




What Is a Gap Down? Meaning, Examples, and How Traders Use It
A gap down happens when a stock opens at a price well below its previous close, leaving an empty space on the chart. No trades take place inside that space. If you are asking what is a gap down in...

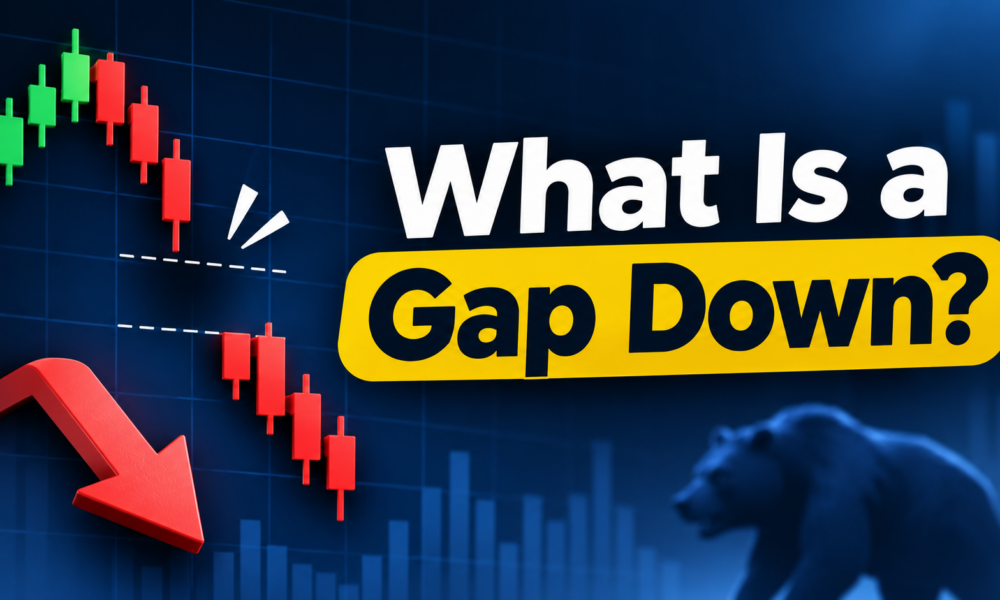
A gap down happens when a stock opens at a price well below its previous close, leaving an empty space on the chart. No trades take place inside that space. If you are asking what is a gap down in simple terms, it is a sudden price drop between one trading session and the next.
Table Of Content
This is also called a bearish gap or a market gap to the downside. Traders watch it closely because it shows that sellers took control before the market even opened for normal trading.
What Is a Gap Down on a Chart?
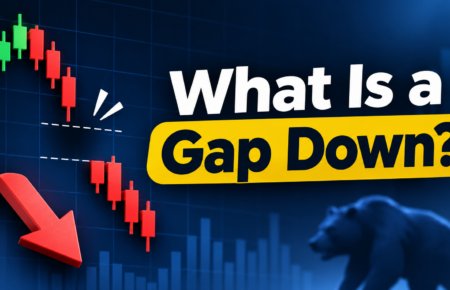
On a candlestick chart, it is easy to spot. Look at the opening price of today’s candle and compare it with the previous close, which is the last price of the earlier session. If today’s open sits below yesterday’s low, you can see a visible hole between the two candles.
What Causes a Gap Down in the Stock Market?
In stock market trading usually starts with news that arrives while the exchange is closed. Buyers and sellers cannot react until the next open, so the new price reflects all that built-up pressure at once.
Market prices can react to company-specific and broader economic news, which can influence expectations before the next trading session. NSE Investor Education – Getting Started
Common triggers include:
- Negative overnight news, such as a regulatory problem or a major lawsuit.
- Weak results in an earnings announcement.
- Poor guidance, where management expects lower sales or profit ahead.
- Global market weakness, especially a sharp fall in US or Asian markets.
- Heavy selling pressure from large investors before the open.
- A sudden change in market sentiment, like fear about rates or the economy.
Example
Say a stock closes at ₹500 on Monday. After the close, the company reports weaker profit than analysts expected. On Tuesday morning, the stock opens at ₹470.
It is ₹30, which is 6% of the previous close. No trades happened between ₹470 and ₹500 at the open, so the chart shows a blank space there.
Gap Down vs Gap Up
A gap up is the opposite. The stock opens above its previous close, often after good news. A gap down vs gap up comparison is simple: one shows eager buyers, the other shows eager sellers.
How Traders Read
Most traders see it as a sign of bearish sentiment. They check a few other things first.
Support and Resistance
If the stock opens below a key support level, the drop looks more serious because buyers failed to defend it. If it opens near support, buyers may step in. Broken support often turns into a resistance level when the price tries to recover.
Volume Confirmation
High volume on the gap shows many traders agree with the move. Low volume suggests weak conviction, and the price may bounce back faster.
Gap Fill
A gap fill happens when the price climbs back to the previous close and closes the empty space. Some gaps fill within days. Others stay open for weeks, especially when the news behind them is serious.
A Practical Trading Strategy
This is general education, not personal advice. Many traders wait for confirmation instead of reacting to the first print. For example, they may watch the first 15 to 30 minutes to see whether sellers keep control or buyers push the price back up.
Risk control comes first. A stop-loss is an order that exits a trade at a set price, which limits the damage if the move goes wrong. Gaps can be wild, so traders often use smaller position sizes and keep a clear plan before they enter.
Key Takeaway
What is a gap down? It is a drop between the previous close and the next opening price. Read it with volume and support levels, and always plan your own stop-loss.