




What Is Market Depth?
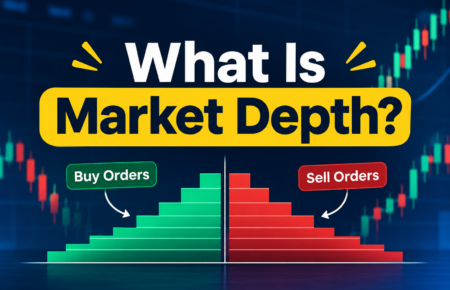
Basically, Market Depth is a measure of how many buy and sell orders are waiting in the market at different price levels. It shows how much liquidity a stock has and how stable its price is likely to...

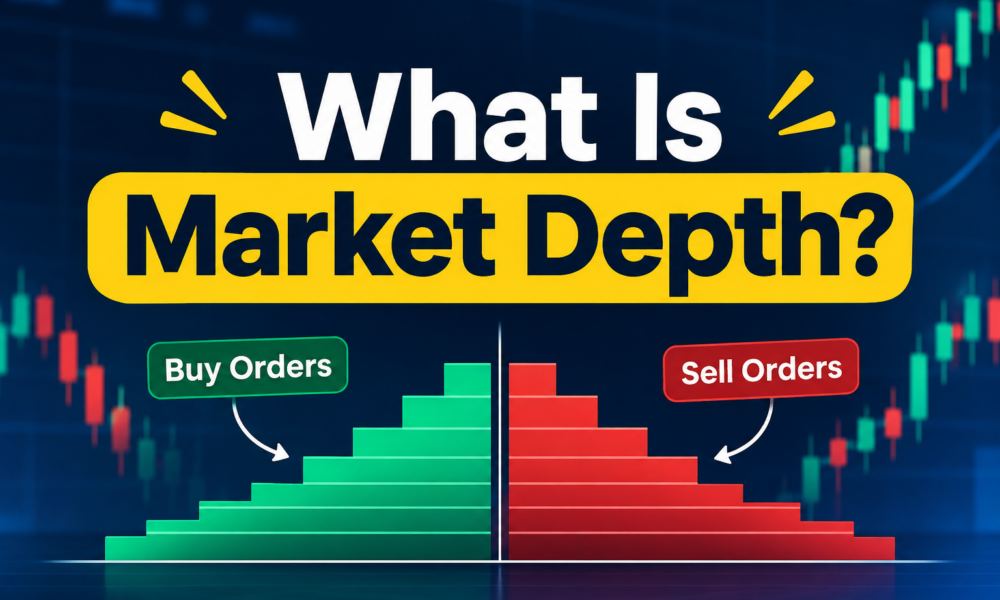
Basically, Market Depth is a measure of how many buy and sell orders are waiting in the market at different price levels. It shows how much liquidity a stock has and how stable its price is likely to stay when trades come in. Traders also call it the depth of market.
Table Of Content
This guide answers a common question: what is market depth in trading and how does it work? It uses plain language and a simple example to make order book data easier to read on any trading platform.
Market Depth Meaning in Trading
Basically, it shows the volume of pending buy orders and sell orders at each price level, not just the best price available right now.
A deep market can absorb large orders without a major price change. A shallow market may see noticeable price movement from comparatively smaller orders. This is why stock market depth is a key detail for anyone placing trades.
How does it Works in an Order Book
An order book lists every active bid and ask order in a market. Bids are buy orders from traders willing to pay a set price. Asks are sell orders from traders willing to sell at a set price.
Each row in the book is a price level, with the number of shares waiting at that level. The highest bid and the lowest ask sit at the top, and the gap between them is the bid-ask spread. Many platforms also show cumulative order quantity, which adds up the shares as prices move away from the best bid or ask.
It is displayed through an order book or a depth chart on a trading platform. NSE provides Level 2 market data showing market depth for the best five bid and ask prices. Order book data is dynamic and can change within seconds.
Example
Say a stock trades near $50. The order book shows 2,000 shares bid at $49.95, 3,000 at $49.90, and 5,000 at $49.85. On the ask side, 1,500 shares are offered at $50.05, 2,000 at $50.10, and 4,000 at $50.20.
A trader places a market order to buy 6,000 shares. The first 1,500 fill at $50.05, the next 2,000 at $50.10, and the last 2,500 at $50.20. The average price lands above $50.05 as cheaper sell orders disappear.
Why it Matters for Traders
Depth shows how easily a trade can be filled. In a deep market with strong liquidity, even large orders can execute close to the quoted price. In a thin market, the same order may have to climb through several price levels.
Traders watch depth for a few practical reasons:
- Slippage: the gap between the expected price and the actual fill price.
- Price impact: how far a trade pushes the market.
- Execution quality: how close fills land to the price the trader wanted.
Market Depth vs. Trading Volume
Trading volume counts shares that have already traded over a period. It shows orders still waiting to trade right now. One looks back, and the other looks at what is available at this moment.
High trading volume does not automatically guarantee strong market depth. A stock can trade millions of shares a day while its order book stays thin at most price levels. It is related to liquidity but is not exactly the same thing, because market liquidity also covers how quickly and cheaply assets can be traded.
Factors that Affect
Several things shape depth:
- Trading volume: steady activity attracts more orders.
- Active participants: more traders mean more bids and asks.
- Stock popularity: well-known companies draw heavier interest.
- Market conditions: news or panic can empty the book fast.