




What Is Trading Volume?
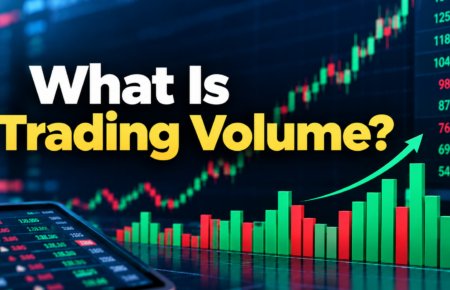
What is trading volume? It is the total number of shares or contracts traded in a stock during a set period, usually one trading day. Every time a buyer and a seller complete a deal, that quantity...

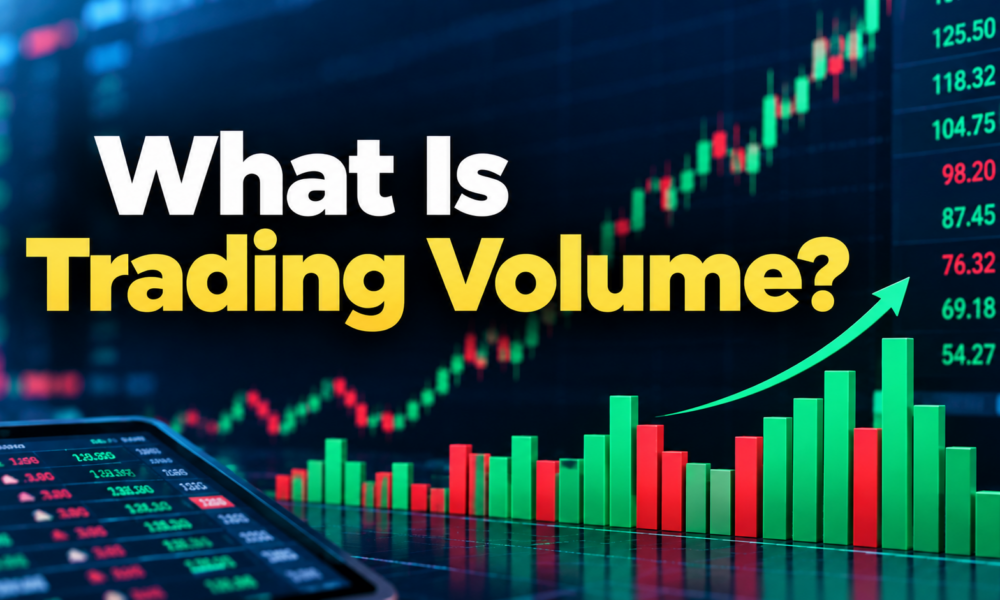
What is trading volume? It is the total number of shares or contracts traded in a stock during a set period, usually one trading day. Every time a buyer and a seller complete a deal, that quantity gets added to the day’s volume. It is one of the simplest stock market indicators, and almost every chart on every platform shows it.
Table Of Content
Trading Volume in Stock Market: A Simple Example
Let us say shares of an Indian company are bought and sold during a day. Ravi buys 200 shares from one seller. Meena buys 300 shares from another. A third trader buys 500 shares. The stock trading volume for that day is 1,000 shares. It does not matter how many people were involved or how the price moved. Volume only counts the shares that changed hands.
Why Is Trading Volume Important for Traders?
Volume tells you how busy a stock is. A heavily traded stock shows strong market activity, which usually means many people are interested in it. It also reflects liquidity, meaning how easily you can buy or sell without moving the price much. Volume even hints at buying and selling pressure, and it helps you judge how much strength sits behind a price movement. A price change backed by many shares feels more believable than one made by a handful of trades.
High Trading Volume vs Low Trading Volume
What does high trading volume mean in stocks? Usually it means many buyers and sellers are active at the same time. Orders get filled quickly, and the gap between buying and selling prices tends to stay small. High volume often shows up around results, news, or big announcements.
Low trading volume meaning is the opposite. Fewer people are trading, so interest looks limited. Placing a large order can be harder, since there may not be enough sellers at your price. Prices in thinly traded stocks can also jump around on small orders. That is the main difference between high and low trading volume: one gives you ease and depth, the other can bring delays and wider price gaps.
Before placing a trade, beginners should check a stock’s liquidity and understand the common mistakes in intraday trading to make more informed trading decisions.
How Traders Use Trading Volume Analysis
Trading volume analysis is a core part of technical analysis. Traders compare today’s volume with the average daily trading volume, often over the last 20 or 50 days, to see whether activity is unusually high or low.
Here is how it usually works. If a stock’s price rises and volume rises too, it suggests stronger buying interest. If the price rises on weak volume, the move may lack conviction and could fade. When a stock breaks above a resistance level, a price the stock has struggled to cross before, a jump in volume is often read as breakout confirmation. A breakout on thin volume is treated with more caution. Volume can also hint at reversals. A sharp fall on very heavy volume, for example, may show that sellers are in control, while a sudden spike after a long decline can sometimes signal that selling is getting exhausted.
How does trading volume affect stock price? It does not move the price by itself. Price changes when buyers and sellers disagree on value. Volume simply shows how strongly the crowd is behind that move, which makes it a useful read on market sentiment.
How to Check Trading Volume
Checking volume in the share market is easy. Most trading apps and websites show it on the stock quote page. On a chart, look for the volume bars at the bottom, below the price candles. Taller bars mean more shares traded in that period, and green or red colours often show whether the price closed higher or lower. You can also find official figures on the NSE and BSE websites.
Trading Volume vs Open Interest
Trading volume counts the shares or contracts traded in a period. Open interest, used in futures and options, shows how many contracts are still open and not yet closed or settled. Volume shows activity, while open interest shows how many positions remain active.
Key Takeaway for Beginners
What is trading volume? It is the number of shares traded, showing market activity and liquidity. Use it with price, never as a guarantee.