




• contact@stockmarketsimplified.com
stockmarketsimplified stockmarketsimplified
  • Home
  • Glossary
  • Contact
Search the Site
Popular Searches:
iPhone Artificial Intelligence Smartphones
Recent Posts
Concentration Risk
What Is Concentration Risk? 
September 28, 2026
implied volatility
What Is Implied Volatility?
September 27, 2026
SME IPO Risks
9 SME IPO Risks to Know Before You Invest 
September 26, 2026
stockmarketsimplified stockmarketsimplified
  • Home
  • Glossary
  • Contact
Popular News
What Is a Doji Candlestick? A Doji candlestick appears like a plus sign or a cross on stock charts. If you've seen one, that's what it is. In simple terms, a Doji candlestick forms when the open and close prices of a stock are almost the same. It shows a tug-of-war between buyers and sellers, where neither side wins clearly. The Doji is a key candlestick pattern for beginners to learn. Doji Candlestick Meaning The word "Doji" comes from Japanese, and it roughly means "mistake" or "the same." That's fitting because a Doji candle shows a moment when the market couldn't decide which way to go. Think of it as a rope-pulling contest. Buyers pull one way, while sellers pull the other. By the end of the session, both sides are nearly back where they began. That's the core Doji pattern meaning for beginners. How a Doji Candle Forms (Open and Close Prices) Every candlestick has four price points: open, high, low, and close. In a normal candle, the open and close prices differ quite a bit, which gives the candle a thick body. In a Doji candlestick, the open and close prices are nearly equal. This forms a thin or nearly invisible body. Wicks, or shadows, extend above and below. Those wicks show how much the price moved during the session. Then, it returned close to the opening level. Main Types of Doji Patterns Not all Doji candles look the same. Here are the main types every trader should recognize: Standard/Neutral Doji: Small wicks on both sides, showing balanced indecision Long-Legged Doji: This candle has long wicks on both sides. It shows that the price moved a lot but closed close to the open. This shows strong trading indecision Dragonfly Doji: Looks like a "T". The long lower wick shows sellers pushed the price down, but buyers pulled it back up by close. Often seen near the bottom of a downtrend Gravestone Doji: Looks like an upside-down "T". A long upper wick shows buyers pushed the price up, but sellers dragged it back down. Often seen near the top of an uptrend What Does a Doji Tell Traders? (Indecision & Reversal Signals) A Doji pattern mainly signals one thing: uncertainty. Neither buyers nor sellers have full control during that session. A Doji after a strong trend is important. It can signal a possible reversal pattern. This means the current trend may be losing power and could change direction. A Dragonfly Doji that appears after a downtrend can signal a bullish reversal. In contrast, a Gravestone Doji after an uptrend may signal a bearish trend. But here's the honest part: a single Doji candle doesn't confirm anything on its own. It's a warning sign, not a certainty. How to Use Doji Candlestick in Trading (With Caution) To read Doji candlestick patterns well, don't rely on the candles; always use other tools too. Check the trend before and after the doji Look at support and resistance levels nearby Confirm with volume since a Doji on high volume carries more weight Wait for the next candle to confirm the direction It is like reading one line of a book. You can get hints, but not the full story. Doji Candlestick in the Indian Stock Market Context Doji candles frequently appear for Indian traders on the NSE and BSE. This is especially true during results season or major news events. These times bring more uncertainty to the market. Many beginners in the Indian stock market feel excited when they spot a Doji candlestick. They often expect an immediate reversal. That's a common mistake. Experienced traders treat it as one piece of the puzzle, not the whole picture. If you're new, start by finding Doji patterns on index charts like Nifty or Bank Nifty. Watch what happens after they form, and note how price reacts near key levels. Over time, this pattern recognition becomes second nature. A Doji candlestick is important for beginners. It boosts confidence in reading price charts. This knowledge can lead to better trading decisions.
What Is a Doji Candlestick?
September 24, 2026
Portfolio Diversification
What Is Portfolio Diversification?
September 23, 2026
What is hedging in the stock market
What Is Hedging in the Stock Market? 
September 22, 2026
Follow Us
Subscribe
Home/Stock Market/SEBI Mutual Fund Rules 2026: What Investors Need to Know
Stock Market

SEBI Mutual Fund Rules 2026: What Investors Need to Know

If you have a SIP running, or you’re just getting started with mutual funds, you’ve probably heard some buzz about new rules from the regulator. Here’s the short version: SEBI has...

Suhani
Suhani
August 18, 2026 6 Min Read
328 0
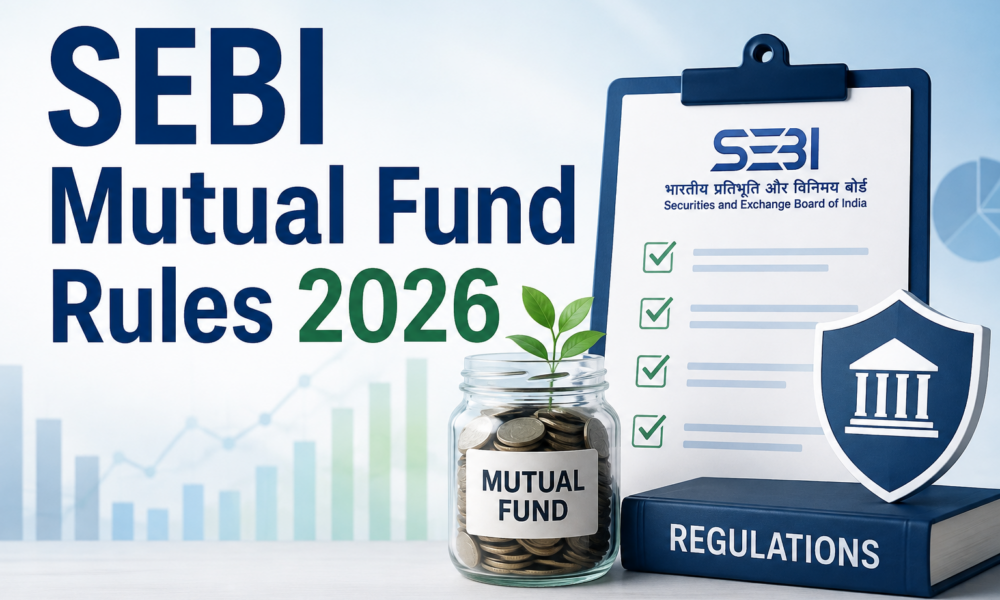
SEBI mutual fund rules 2026

If you have a SIP running, or you’re just getting started with mutual funds, you’ve probably heard some buzz about new rules from the regulator. Here’s the short version: SEBI has rewritten its mutual fund rulebook for the first time in nearly three decades. The SEBI mutual fund rules 2026 replace the old 1996 regulations and kick in from 1 April 2026.

Table Of Content

  • What Are SEBI Mutual Fund Regulations 2026?
  • Key Changes Every Investor Should Know
  • How These Rules Affect Your SIPs and Existing Funds
  • New Categories & Disclosures in Simple Language
  • Where to Check Official Information & Use Safe Platforms
  • FAQs
  • Conclusion

This isn’t a minor tweak. The SEBI new mutual fund rules 2026 touch how funds are categorised, how much equity certain schemes must hold, what counts as “overlap” between similar funds, and even how some existing fund types will disappear. This guide breaks it down the way a friend would, not a lawyer.

What Are SEBI Mutual Fund Regulations 2026?

In plain terms, the SEBI Mutual Fund Regulations 2026 are a fresh set of rules that govern how every mutual fund in India is structured, labelled, and run. They’re issued by SEBI, the market regulator, and apply across the board, from the fund house managing your money to the scheme your SIP sits in.

The whole point of these new SEBI rules for mutual funds 2026 boils down to one idea: funds should be “true to label.” A fund’s name should actually reflect what it invests in, instead of using a catchy title while quietly drifting from its stated strategy. Alongside that, SEBI is pushing for cleaner disclosures and stronger investor protection.

Key Changes Every Investor Should Know

Here’s where it gets specific, the changes most likely to affect your existing investments or your next SIP.

Higher equity minimums (65% → 80%)

Certain equity categories, ELSS, Value, Contra, Focused, and Dividend Yield funds, now need to hold at least 80% in equity, up from the earlier 65%. This is the SEBI 80% equity rule for mutual funds 2026 in a nutshell. The remaining 20% can go into debt, or small allocations to gold, silver, REITs, and InvITs. If you have an ELSS fund for tax saving, this is where the SEBI ELSS rules 2026 come in, your fund will lean more heavily into pure equity, which usually makes it behave more predictably.

Revised fund categories

The SEBI mutual fund categorisation 2026 update also fine-tunes definitions across the board:

  • Large Cap funds: minimum 80% in large-cap stocks
  • Mid Cap and Small Cap funds: minimum 65% in their respective segments
  • Flexi Cap funds: minimum 65% in equity, but flexible across market caps
  • Multi Cap funds: at least 25% each in large, mid, and small cap
  • Large & Mid Cap funds: at least 35% each in large and mid cap

Portfolio overlap norms

Ever noticed that two “different” thematic or sectoral funds from the same AMC hold almost identical stocks? SEBI is cracking down on this with SEBI portfolio overlap rules mutual funds, sectoral and thematic equity schemes can’t overlap by more than 50% with other equity schemes (barring large-cap funds), tracked quarterly. Fund houses now also get to offer both Value and Contra funds side by side, as long as the overlap between them stays under that same 50% cap.

A new category: Life Cycle Funds

The SEBI life cycle funds rules 2026 introduce a fresh category designed as long-term target-date investment products. These are target-maturity funds with tenures from 5 to 30 years, following a glide path that gradually shifts money from equity to debt as the target date approaches, like a fund that automatically gets more conservative as your goal, say your child’s college fund, gets closer.

Solution-oriented funds are being phased out

Retirement funds and children’s funds, previously grouped as “solution-oriented” schemes, are no longer open for fresh subscriptions. Existing investors aren’t left stranded, these schemes are expected to merge into comparable categories over time, so watch for communication from your fund house if you hold one.

Stricter naming rules, and room for gold and silver

Fund names now have to match what’s actually inside the portfolio, part of the broader push behind the SEBI mutual fund changes 2026. Equity funds can also hold limited portions of gold, silver, REITs, and InvITs for added liquidity, and foreign securities are no longer treated as a separate asset class, all examples of the SEBI mutual fund latest rules simplifying portfolio structures.

How These Rules Affect Your SIPs and Existing Funds

If you’re running a SIP right now, here’s the practical part.

For ELSS and thematic funds especially, expect some portfolio rebalancing as fund managers adjust to the new equity minimums and overlap caps. This doesn’t mean you need to stop your SIP, the fund you’re invested in may just look a little different a year from now, hopefully more aligned with what its name promises.

The bigger idea behind the SEBI mutual fund rules for SIP investors is reducing “closet indexing,” where a fund claims an active or thematic strategy but behaves like a plain index fund while charging higher fees. With tighter labelling and overlap rules, that gap should shrink.

If your fund’s category doesn’t comply with the new definitions, it may get merged or reclassified, with fund houses given roughly a three-year window to sort this out. You’ll get formal communication if your scheme is affected. For SEBI mutual fund rules for beginners, this is genuinely good news, cleaner categories make it easier to compare funds and pick ones that match your goals.

New Categories & Disclosures in Simple Language

Beyond Life Cycle Funds, the SEBI mutual fund master circular 2026 brings tighter rules on how costs and risks are disclosed. Fund houses now have to be more upfront about what a scheme charges and what it actually invests in.

On the cost side, the SEBI mutual fund expense ratio rules 2026 move toward a more transparent structure, separating the fund manager’s own fee from other costs like brokerage and statutory charges, instead of bundling everything into one number. The SEBI mutual fund disclosure norms 2026 also push for more detailed and standardized disclosures, detailed portfolio disclosures, so investors aren’t left guessing what’s inside a fund between statements.

Where to Check Official Information & Use Safe Platforms

With any regulatory change, it’s worth knowing where to verify things yourself rather than relying on secondhand summaries. Here are the go-to sources:

  • SEBI’s official website — for the regulations and all official circulars
  • AMFI (Association of Mutual Funds in India) — for investor education material and fund data
  • CAMS and KFinTech — the two main Registrar and Transfer Agents for checking your holdings
  • BSE StAR MF and NSE NMF II — official platforms for transacting in mutual funds
  • SEBI SCORES — the portal for filing complaints against a fund house or intermediary

These are the official SEBI mutual fund apps and platforms worth bookmarking. If you’re wondering where to check SEBI mutual fund information or looking for SEBI mutual fund official links, start here rather than social media or forwarded messages. Some material is also available in regional languages, including a SEBI mutual fund rules 2026. Many investor education resources are available in Hindi and other regional languages through SEBI and AMFI.

FAQs

When do the SEBI mutual fund rules 2026 actually come into effect?

From 1 April 2026. That’s the date the new SEBI (Mutual Funds) Regulations, 2026 take over from the old 1996 framework.

Do I need to do anything with my existing SIP right now?

Not really. Your SIP keeps running as usual. If your fund’s category or portfolio needs to change to meet the new rules, your fund house will handle that and inform you — you don’t need to pause or restart anything yourself.

Will my ELSS fund’s tax benefit change under the new rules?

No, the Section 80C tax benefit on ELSS stays the same. What’s changing is the minimum equity exposure, which goes up to 80%, so your fund will hold more equity than it did before.

Is there a Hindi version of these rules available?

Yes, SEBI and AMFI publish investor education material in Hindi and other regional languages alongside the English versions, so you don’t have to rely only on English documentation.

Conclusion

To sum up this SEBI mutual fund rules 2026 summary: the changes are really about three things, clarity, transparency, and better protection for you as an investor. Higher equity minimums, stricter overlap caps, honest naming, and a new Life Cycle Fund category all point in the same direction, making sure a fund does what it says it does.

Most investors will come out ahead here. Cleaner categories and more honest labelling mean fewer surprises and easier comparisons when you’re choosing where to put your money. As you plan your next SIP under the SEBI mutual fund rules 2026, take a few minutes to review your current funds, check their category, look at what’s actually in the portfolio, and make sure it still lines up with your goals. A little review now saves confusion later.


Share Article

Suhani

Suhani Content Writer

Suhani is a skilled finance content writer dedicated to creating insightful, engaging, and reader-focused content. With a deep understanding of personal finance, investments, market trends, and financial planning, Suhani excels at turning complex financial topics into simple, actionable insights. From demystifying tax strategies to exploring smart investment options, Suhani provides readers with the knowledge they need to achieve financial success. Known for a professional yet approachable writing style, Suhani blends research, clarity, and creativity to craft content that resonates with diverse audiences. Trusted by clients and readers alike, Suhani is your go-to expert for finance content.

What Is ASM in the Share Market?
Previous Post

What is ASM in the Share Market?

Active vs Passive ETFs
Next Post

Active vs Passive ETFs

Top Authors
Suhani
SuhaniContent Writer
99 Posts
Manaswi Agarwal
Manaswi AgarwalContent Writer (Finance, Stock market)
50 Posts
Top Categories
Stockmarket Simplified Stockmarket Simplified
50 Posts
Glossary Glossary
58 Posts
Most Viewed
What Is a Doji Candlestick? A Doji candlestick appears like a plus sign or a cross on stock charts. If you've seen one, that's what it is. In simple terms, a Doji candlestick forms when the open and close prices of a stock are almost the same. It shows a tug-of-war between buyers and sellers, where neither side wins clearly. The Doji is a key candlestick pattern for beginners to learn. Doji Candlestick Meaning The word "Doji" comes from Japanese, and it roughly means "mistake" or "the same." That's fitting because a Doji candle shows a moment when the market couldn't decide which way to go. Think of it as a rope-pulling contest. Buyers pull one way, while sellers pull the other. By the end of the session, both sides are nearly back where they began. That's the core Doji pattern meaning for beginners. How a Doji Candle Forms (Open and Close Prices) Every candlestick has four price points: open, high, low, and close. In a normal candle, the open and close prices differ quite a bit, which gives the candle a thick body. In a Doji candlestick, the open and close prices are nearly equal. This forms a thin or nearly invisible body. Wicks, or shadows, extend above and below. Those wicks show how much the price moved during the session. Then, it returned close to the opening level. Main Types of Doji Patterns Not all Doji candles look the same. Here are the main types every trader should recognize: Standard/Neutral Doji: Small wicks on both sides, showing balanced indecision Long-Legged Doji: This candle has long wicks on both sides. It shows that the price moved a lot but closed close to the open. This shows strong trading indecision Dragonfly Doji: Looks like a "T". The long lower wick shows sellers pushed the price down, but buyers pulled it back up by close. Often seen near the bottom of a downtrend Gravestone Doji: Looks like an upside-down "T". A long upper wick shows buyers pushed the price up, but sellers dragged it back down. Often seen near the top of an uptrend What Does a Doji Tell Traders? (Indecision & Reversal Signals) A Doji pattern mainly signals one thing: uncertainty. Neither buyers nor sellers have full control during that session. A Doji after a strong trend is important. It can signal a possible reversal pattern. This means the current trend may be losing power and could change direction. A Dragonfly Doji that appears after a downtrend can signal a bullish reversal. In contrast, a Gravestone Doji after an uptrend may signal a bearish trend. But here's the honest part: a single Doji candle doesn't confirm anything on its own. It's a warning sign, not a certainty. How to Use Doji Candlestick in Trading (With Caution) To read Doji candlestick patterns well, don't rely on the candles; always use other tools too. Check the trend before and after the doji Look at support and resistance levels nearby Confirm with volume since a Doji on high volume carries more weight Wait for the next candle to confirm the direction It is like reading one line of a book. You can get hints, but not the full story. Doji Candlestick in the Indian Stock Market Context Doji candles frequently appear for Indian traders on the NSE and BSE. This is especially true during results season or major news events. These times bring more uncertainty to the market. Many beginners in the Indian stock market feel excited when they spot a Doji candlestick. They often expect an immediate reversal. That's a common mistake. Experienced traders treat it as one piece of the puzzle, not the whole picture. If you're new, start by finding Doji patterns on index charts like Nifty or Bank Nifty. Watch what happens after they form, and note how price reacts near key levels. Over time, this pattern recognition becomes second nature. A Doji candlestick is important for beginners. It boosts confidence in reading price charts. This knowledge can lead to better trading decisions.
What Is a Doji Candlestick?
September 24, 2026
Portfolio Diversification
What Is Portfolio Diversification?
September 23, 2026
What is hedging in the stock market
What Is Hedging in the Stock Market? 
September 22, 2026

Related Posts

SME IPO Risks
Stock Market
9 SME IPO Risks to Know Before You Invest 
Suhani
By Suhani
Primary Market vs Secondary Market
Stock Market
Primary Market vs Secondary Market: Key Differences 
Suhani
By Suhani
Hedging in the Stock Market
Stock Market
What is Hedging in the Stock Market?
Suhani
By Suhani
Types of Stock Exchanges in India
Stock Market
Types of Stock Exchanges in India: NSE, BSE & More 
Suhani
By Suhani
instagram image
instagram image
instagram image
instagram image
instagram image
instagram image
Instagram
stockmarketsimplified stockmarketsimplified
  • contact@stockmarketsimplified.com
Helpful Links
  • Glossary
  • Contact
  • Privacy Policy
  • Terms And Conditions
Popular Posts
What Is Concentration Risk? 
Suhani
September 28, 2026
What Is Implied Volatility?
Suhani
September 27, 2026
9 SME IPO Risks to Know Before You Invest 
Suhani
September 26, 2026
Follow Us
Facebook
Twitter
Youtube
Instagram
Stay Informed
©Copyright 2026. stockmarketsimplified.com. All Rights Reserved