


What Is a Doji Candlestick?
A Doji candlestick appears like a plus sign or a cross on stock charts. If you have seen one, that’s what it is. In simple terms, a Doji candlestick forms when the open and close prices of a...

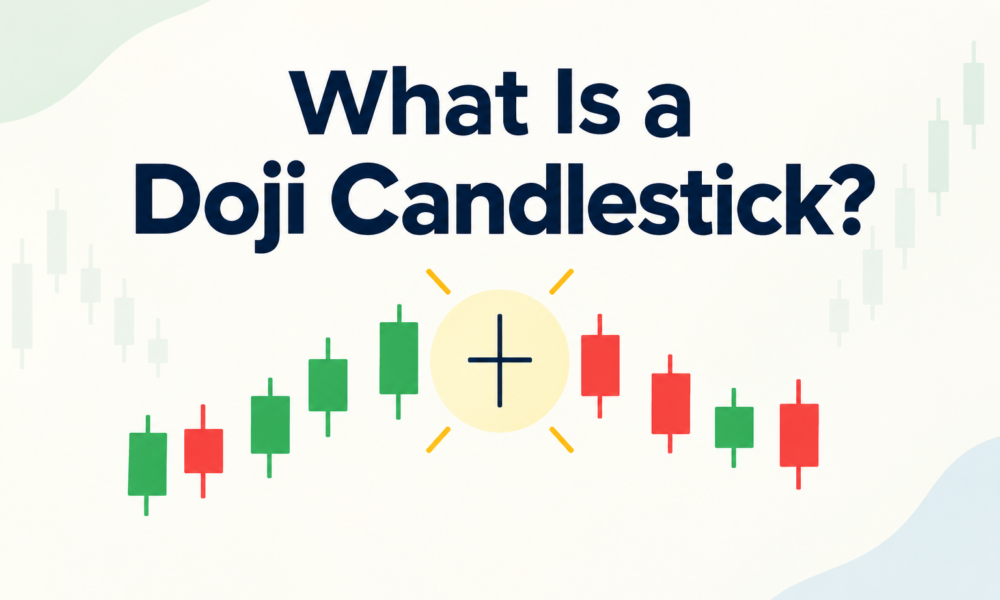
A Doji candlestick appears like a plus sign or a cross on stock charts. If you have seen one, that’s what it is. In simple terms, a Doji candlestick forms when the open and close prices of a stock are almost the same. It shows a tug-of-war between buyers and sellers, where neither side wins clearly.
Table Of Content
The Doji is a key candlestick pattern for beginners to learn.
Doji Candlestick Meaning
The word “Doji” comes from Japanese, and it roughly means “mistake” or “the same.” That’s fitting because a Doji candle shows a moment when the market couldn’t decide which way to go.
Think of it as a rope-pulling contest. Buyers pull one way, while sellers pull the other. By the end of the session, both sides are nearly back where they began. That’s the core Doji pattern meaning for beginners.
How a Doji Candle Forms (Open and Close Prices)
Every candlestick has four price points: open, high, low, and close. In a normal candle, the open and close prices differ quite a bit, which gives the candle a thick body.
In a Doji candlestick, the open and close prices are nearly equal. This forms a thin or nearly invisible body. Wicks, or shadows, extend above and below. Those wicks show how much the price moved during the session. Then, it returned close to the opening level.
Types of Doji Patterns
Not all Doji candles look the same. Here are the main types every trader should recognize:
- Standard/Neutral Doji: Small wicks on both sides, showing balanced indecision
- Long-Legged Doji: This candle has long wicks on both sides. It shows that the price moved a lot but closed close to the open. This shows strong trading indecision
- Dragonfly Doji: Looks like a “T”. The long lower wick shows sellers pushed the price down, but buyers pulled it back up by close. Often seen near the bottom of a downtrend
- Gravestone Doji: Looks like an upside-down “T”. A long upper wick shows buyers pushed the price up, but sellers dragged it back down. Often seen near the top of an uptrend
What Does a Doji Tell Traders? (Indecision & Reversal Signals)
A Doji pattern mainly signals one thing: uncertainty. Neither buyers nor sellers have full control during that session.
A Doji after a strong trend is important. It can signal a possible reversal pattern. This means the current trend may be losing power and could change direction. A Dragonfly Doji that appears after a downtrend can signal a bullish reversal. In contrast, a Gravestone Doji after an uptrend may signal a bearish trend.
But here’s the honest part: a single Doji candle doesn’t confirm anything on its own. It’s a warning sign, not a certainty.
How to Use Doji Candlestick in Trading (With Caution)
To read Doji candlestick patterns well, don’t rely on the candles; always use other tools too.
- Check the trend before and after the doji
- Look at support and resistance levels nearby
- Confirm with volume since a Doji on high volume carries more weight
- Wait for the next candle to confirm the direction
It is like reading one line of a book. You can get hints, but not the full story.
Doji Candlestick in the Indian Stock Market Context
Doji candles frequently appear for Indian traders on the NSE and BSE. This is especially true during results season or major news events. These times bring more uncertainty to the market.
Many beginners in the Indian stock market feel excited when they spot a Doji candlestick. They often expect an immediate reversal. That’s a common mistake. Experienced traders treat it as one piece of the puzzle, not the whole picture.
If you’re new, start by finding Doji patterns on index charts like Nifty or Bank Nifty. Watch what happens after they form, and note how price reacts near key levels. Over time, this pattern recognition becomes second nature.
A Doji candlestick is important for beginners. It boosts confidence in reading price charts. This knowledge can lead to better trading decisions.