



What Is a Golden Crossover?
A golden crossover is a chart pattern that appears when a short-term moving average climbs above a long-term one. Most often, that means the 50-day moving average moving above the 200-day moving...

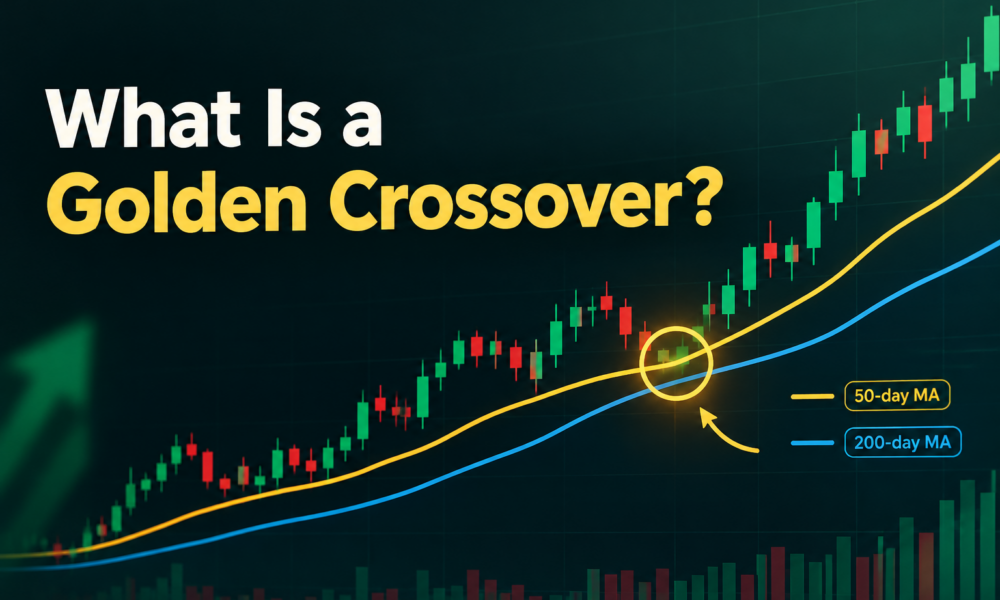
A golden crossover is a chart pattern that appears when a short-term moving average climbs above a long-term one. Most often, that means the 50-day moving average moving above the 200-day moving average. Traders read it as a bullish signal, a hint that buying pressure may be building after a stretch of weakness.
Table Of Content
It is one of the most watched patterns in technical analysis.
Golden Crossover Meaning
In plain terms, the golden crossover meaning comes down to momentum. Recent prices are beginning to outpace older prices. When the average of the last 50 trading days rises above the average of the last 200, it suggests the stock’s recent performance is stronger than its longer history.
That shift matters because moving averages smooth out daily noise. A change in the averages takes weeks or months to develop, so it reflects a broader price trend rather than a passing burst of excitement.
How Does a Golden Crossover Work?
A moving average takes the closing prices over a set number of days and averages them. Each day, the oldest price drops out and the newest one enters, so the line moves along with the chart.
The 50-day line reacts faster because it covers a shorter window. The 200-day line moves slowly and represents the long-term trend. Usually, a stock recovering from a decline sees its 50-day line rise until it meets the 200-day line, and then pass it. That moment is the bullish crossover.
Here is a simple example. Suppose a stock slid for months and now trades around $80, with its 200-day average at $90. Over the next few weeks, the shares recover to $100. The 50-day average climbs from $78 to $91 and finally moves past the 200-day at $90. Chart platforms usually mark that point automatically, and traders call it a golden crossover in stocks.
Why Is a Golden Crossover Considered Bullish?
Many investors see the crossover as a bullish signal that a downtrend has lost strength and buyers are regaining control. Because it relies on the 200-day line, a well-known reference for the long-term trend, it carries more weight than shorter-term patterns.
The pattern also feeds on attention. When enough market participants watch the same trading signal, their reactions can add momentum. Some funds and screening tools even flag these events automatically, which puts the stock on more radars.
Golden crossover trading typically takes a few forms. Some traders buy shortly after the cross. Others wait for a pullback toward the moving averages. Long-term investors may simply use it as one piece of evidence that a stock is turning a corner.
Golden Crossover vs Death Cross
The death cross is the mirror image. It happens when the 50-day moving average falls below the 200-day moving average, and traders treat it as a bearish warning. Where the golden crossover hints at strengthening momentum, the death cross hints at fading strength.
Both work on the same logic and share the same weaknesses. Neither one predicts the future. They only describe what price has already done.
Limitations of a Golden Crossover
The biggest flaw is timing. Moving averages are lagging indicators, so by the time the lines cross, a good part of the rally may already be behind you. Buying late can mean paying a higher price.
False signals also happen. In a choppy stock market, the two averages can cross back and forth several times, producing whipsaws that leave traders with small losses. A crossover can also fade quickly if conditions turn.
For these reasons, no golden crossover strategy should stand on its own. Like most technical analysis tools, it works best as a supporting clue. Pairing the trading signal with volume, earnings, valuation, and overall market conditions gives a fuller picture. Sensible risk management, such as position sizing and stop-loss levels, matters just as much.
The Practical Takeaway
A golden crossover is a useful clue, not a promise. It shows that the stock market may be shifting toward a more positive tone for a particular stock, but it says nothing certain about what comes next. Treat it as a prompt to look closer, then confirm the story with other research before putting money at risk.