




• contact@stockmarketsimplified.com
stockmarketsimplified stockmarketsimplified
  • Home
  • Glossary
  • Contact
Search the Site
Popular Searches:
iPhone Artificial Intelligence Smartphones
Recent Posts
IPO Oversubscription
IPO Oversubscription: Meaning, 5 Reasons and What Happens to Your Allotment
September 30, 2026
Turnaround Stocks
What Is a Turnaround Stock?
September 29, 2026
Concentration Risk
What Is Concentration Risk? 
September 28, 2026
stockmarketsimplified stockmarketsimplified
  • Home
  • Glossary
  • Contact
Popular News
SME IPO Risks
9 SME IPO Risks to Know Before You Invest 
September 26, 2026
portfolio rebalancing
What Is Portfolio Rebalancing?
September 25, 2026
What Is a Doji Candlestick? A Doji candlestick appears like a plus sign or a cross on stock charts. If you've seen one, that's what it is. In simple terms, a Doji candlestick forms when the open and close prices of a stock are almost the same. It shows a tug-of-war between buyers and sellers, where neither side wins clearly. The Doji is a key candlestick pattern for beginners to learn. Doji Candlestick Meaning The word "Doji" comes from Japanese, and it roughly means "mistake" or "the same." That's fitting because a Doji candle shows a moment when the market couldn't decide which way to go. Think of it as a rope-pulling contest. Buyers pull one way, while sellers pull the other. By the end of the session, both sides are nearly back where they began. That's the core Doji pattern meaning for beginners. How a Doji Candle Forms (Open and Close Prices) Every candlestick has four price points: open, high, low, and close. In a normal candle, the open and close prices differ quite a bit, which gives the candle a thick body. In a Doji candlestick, the open and close prices are nearly equal. This forms a thin or nearly invisible body. Wicks, or shadows, extend above and below. Those wicks show how much the price moved during the session. Then, it returned close to the opening level. Main Types of Doji Patterns Not all Doji candles look the same. Here are the main types every trader should recognize: Standard/Neutral Doji: Small wicks on both sides, showing balanced indecision Long-Legged Doji: This candle has long wicks on both sides. It shows that the price moved a lot but closed close to the open. This shows strong trading indecision Dragonfly Doji: Looks like a "T". The long lower wick shows sellers pushed the price down, but buyers pulled it back up by close. Often seen near the bottom of a downtrend Gravestone Doji: Looks like an upside-down "T". A long upper wick shows buyers pushed the price up, but sellers dragged it back down. Often seen near the top of an uptrend What Does a Doji Tell Traders? (Indecision & Reversal Signals) A Doji pattern mainly signals one thing: uncertainty. Neither buyers nor sellers have full control during that session. A Doji after a strong trend is important. It can signal a possible reversal pattern. This means the current trend may be losing power and could change direction. A Dragonfly Doji that appears after a downtrend can signal a bullish reversal. In contrast, a Gravestone Doji after an uptrend may signal a bearish trend. But here's the honest part: a single Doji candle doesn't confirm anything on its own. It's a warning sign, not a certainty. How to Use Doji Candlestick in Trading (With Caution) To read Doji candlestick patterns well, don't rely on the candles; always use other tools too. Check the trend before and after the doji Look at support and resistance levels nearby Confirm with volume since a Doji on high volume carries more weight Wait for the next candle to confirm the direction It is like reading one line of a book. You can get hints, but not the full story. Doji Candlestick in the Indian Stock Market Context Doji candles frequently appear for Indian traders on the NSE and BSE. This is especially true during results season or major news events. These times bring more uncertainty to the market. Many beginners in the Indian stock market feel excited when they spot a Doji candlestick. They often expect an immediate reversal. That's a common mistake. Experienced traders treat it as one piece of the puzzle, not the whole picture. If you're new, start by finding Doji patterns on index charts like Nifty or Bank Nifty. Watch what happens after they form, and note how price reacts near key levels. Over time, this pattern recognition becomes second nature. A Doji candlestick is important for beginners. It boosts confidence in reading price charts. This knowledge can lead to better trading decisions.
What Is a Doji Candlestick?
September 24, 2026
Follow Us
Subscribe
Home/Glossary/What is a Buy Order?
Glossary

What is a Buy Order?

If you’re new to the stock market, you may have wondered: what is a buy order, and what actually happens after you click the Buy button? A buy order is an instruction you give your broker to...

Suhani
Suhani
September 10, 2026 3 Min Read
197 0
What Is a Buy Order?

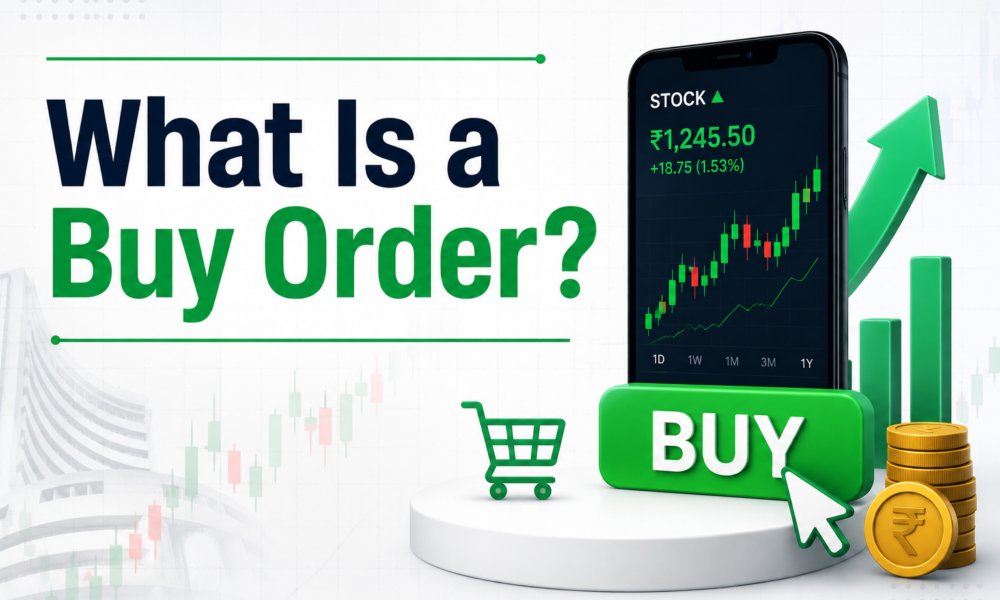
If you’re new to the stock market, you may have wondered: what is a buy order, and what actually happens after you click the Buy button? A buy order is an instruction you give your broker to purchase shares on your behalf. When you open a broker app for the first time, clicking the buy button can feel confusing, especially if you’re unsure what happens next. 

Table Of Content

  • What is a Buy Order in stock market?
  • Types of Buy Orders
  • How to Place a Buy Order Online
  • Conclusion

In simple terms, a buy order is the instruction you give your broker to purchase a specific stock at a specified price or under specific conditions. Once you know what is a buy order and how it moves through the system, buying shares online stops feeling like guesswork.

What is a Buy Order in stock market?

Every buy order starts in your trading account and travels to the stock exchange through your broker. It lands in what’s called the order book, sitting there until it finds a seller willing to match on price and quantity. That matching moment is what traders mean by order execution. You can also learn more about how the NSE trading system handles orders and matching.

A buy order in the stock market isn’t a completed trade the instant you click confirm; it becomes one only after execution. Until that happens, you have placed a request, nothing more. You don’t own the shares yet.

Types of Buy Orders

Not all buy orders work the same way, and picking the right type matters more than beginners usually expect.

  • Market Buy Order: You buy right away at whatever price the stock is at. It’s fast, but you don’t get to pick the exact price.
  • Limit Buy Order: You set the highest price you’re willing to pay. The order only goes through if the stock price drops to that level or lower. You get to control the price, but it might take time, or it might never happen at all.
  • Stop-Buy Order: You set a price above the current price. If the stock rises and hits that price, your order becomes a normal buy order right away, at whatever the market price is then.
  • Stop-Limit Buy Order: This works like the stop-buy order above, but with one difference. Once the stock hits your set price, it doesn’t just buy at any price. Instead, it becomes a limit order, so you still control the final price you pay.
  • Trailing Stop Buy Order: You set a price gap, either a percentage or a fixed amount, above the current stock price. As the price moves, this gap moves with it. If the price ever turns and comes back into that range, the order buys automatically.

How to Place a Buy Order Online

The whole process takes barely a minute once you get the hang of it. Here’s what you need to do:

  • Pick the stock you want to buy
  • Choose NSE or BSE
  • Decide between delivery trading or intraday trading
  • Enter how many shares you want
  • Choose your order type
  • Check the brokerage and other charges
  • Hit confirm

A quick example makes this easier to picture. Say a stock called ABC Ltd is trading around ₹200. You place a limit buy order for 10 shares at ₹198. A seller agrees to sell at that price, your order goes through, and the shares show up in your demat account once the settlement process is done.

It also helps to know the difference between bid price and ask price. The bid is the price buyers are offering. The ask is the price sellers are asking for. The best price to buy a stock is usually somewhere close to where these two prices meet.

Conclusion

Once you understand what is a buy order and how execution really works, the stock market stops feeling like a black box. Order types, timing, and price all play their part, and getting comfortable with them makes buying shares online a far less intimidating step in your investing journey.

Share Article

Suhani

Suhani Content Writer

Suhani is a skilled finance content writer dedicated to creating insightful, engaging, and reader-focused content. With a deep understanding of personal finance, investments, market trends, and financial planning, Suhani excels at turning complex financial topics into simple, actionable insights. From demystifying tax strategies to exploring smart investment options, Suhani provides readers with the knowledge they need to achieve financial success. Known for a professional yet approachable writing style, Suhani blends research, clarity, and creativity to craft content that resonates with diverse audiences. Trusted by clients and readers alike, Suhani is your go-to expert for finance content.

What Is an Entry Price?
Previous Post

What is an Entry Price?

what is a market order
Next Post

What Is a Market Order? 

Top Authors
Suhani
SuhaniContent Writer
101 Posts
Manaswi Agarwal
Manaswi AgarwalContent Writer (Finance, Stock market)
50 Posts
Top Categories
Stockmarket Simplified Stockmarket Simplified
50 Posts
Glossary Glossary
59 Posts
Most Viewed
SME IPO Risks
9 SME IPO Risks to Know Before You Invest 
September 26, 2026
portfolio rebalancing
What Is Portfolio Rebalancing?
September 25, 2026
What Is a Doji Candlestick? A Doji candlestick appears like a plus sign or a cross on stock charts. If you've seen one, that's what it is. In simple terms, a Doji candlestick forms when the open and close prices of a stock are almost the same. It shows a tug-of-war between buyers and sellers, where neither side wins clearly. The Doji is a key candlestick pattern for beginners to learn. Doji Candlestick Meaning The word "Doji" comes from Japanese, and it roughly means "mistake" or "the same." That's fitting because a Doji candle shows a moment when the market couldn't decide which way to go. Think of it as a rope-pulling contest. Buyers pull one way, while sellers pull the other. By the end of the session, both sides are nearly back where they began. That's the core Doji pattern meaning for beginners. How a Doji Candle Forms (Open and Close Prices) Every candlestick has four price points: open, high, low, and close. In a normal candle, the open and close prices differ quite a bit, which gives the candle a thick body. In a Doji candlestick, the open and close prices are nearly equal. This forms a thin or nearly invisible body. Wicks, or shadows, extend above and below. Those wicks show how much the price moved during the session. Then, it returned close to the opening level. Main Types of Doji Patterns Not all Doji candles look the same. Here are the main types every trader should recognize: Standard/Neutral Doji: Small wicks on both sides, showing balanced indecision Long-Legged Doji: This candle has long wicks on both sides. It shows that the price moved a lot but closed close to the open. This shows strong trading indecision Dragonfly Doji: Looks like a "T". The long lower wick shows sellers pushed the price down, but buyers pulled it back up by close. Often seen near the bottom of a downtrend Gravestone Doji: Looks like an upside-down "T". A long upper wick shows buyers pushed the price up, but sellers dragged it back down. Often seen near the top of an uptrend What Does a Doji Tell Traders? (Indecision & Reversal Signals) A Doji pattern mainly signals one thing: uncertainty. Neither buyers nor sellers have full control during that session. A Doji after a strong trend is important. It can signal a possible reversal pattern. This means the current trend may be losing power and could change direction. A Dragonfly Doji that appears after a downtrend can signal a bullish reversal. In contrast, a Gravestone Doji after an uptrend may signal a bearish trend. But here's the honest part: a single Doji candle doesn't confirm anything on its own. It's a warning sign, not a certainty. How to Use Doji Candlestick in Trading (With Caution) To read Doji candlestick patterns well, don't rely on the candles; always use other tools too. Check the trend before and after the doji Look at support and resistance levels nearby Confirm with volume since a Doji on high volume carries more weight Wait for the next candle to confirm the direction It is like reading one line of a book. You can get hints, but not the full story. Doji Candlestick in the Indian Stock Market Context Doji candles frequently appear for Indian traders on the NSE and BSE. This is especially true during results season or major news events. These times bring more uncertainty to the market. Many beginners in the Indian stock market feel excited when they spot a Doji candlestick. They often expect an immediate reversal. That's a common mistake. Experienced traders treat it as one piece of the puzzle, not the whole picture. If you're new, start by finding Doji patterns on index charts like Nifty or Bank Nifty. Watch what happens after they form, and note how price reacts near key levels. Over time, this pattern recognition becomes second nature. A Doji candlestick is important for beginners. It boosts confidence in reading price charts. This knowledge can lead to better trading decisions.
What Is a Doji Candlestick?
September 24, 2026

Related Posts

Turnaround Stocks
Glossary
What Is a Turnaround Stock?
Suhani
By Suhani
Concentration Risk
Glossary
What Is Concentration Risk? 
Suhani
By Suhani
implied volatility
Glossary
What Is Implied Volatility?
Suhani
By Suhani
portfolio rebalancing
Glossary
What Is Portfolio Rebalancing?
Suhani
By Suhani
instagram image
instagram image
instagram image
instagram image
instagram image
instagram image
Instagram
stockmarketsimplified stockmarketsimplified
  • contact@stockmarketsimplified.com
Helpful Links
  • Glossary
  • Contact
  • Privacy Policy
  • Terms And Conditions
Popular Posts
IPO Oversubscription: Meaning, 5 Reasons and What Happens to Your Allotment
Suhani
September 30, 2026
What Is a Turnaround Stock?
Suhani
September 29, 2026
What Is Concentration Risk? 
Suhani
September 28, 2026
Follow Us
Facebook
Twitter
Youtube
Instagram
Stay Informed
©Copyright 2026. stockmarketsimplified.com. All Rights Reserved