





• contact@stockmarketsimplified.com
stockmarketsimplified stockmarketsimplified
  • Home
  • Glossary
  • Contact
Search the Site
Popular Searches:
iPhone Artificial Intelligence Smartphones
Recent Posts
IPO Oversubscription
IPO Oversubscription: Meaning, 5 Reasons and What Happens to Your Allotment
September 30, 2026
Turnaround Stocks
What Is a Turnaround Stock?
September 29, 2026
Concentration Risk
What Is Concentration Risk? 
September 28, 2026
stockmarketsimplified stockmarketsimplified
  • Home
  • Glossary
  • Contact
Popular News
SME IPO Risks
9 SME IPO Risks to Know Before You Invest 
September 26, 2026
portfolio rebalancing
What Is Portfolio Rebalancing?
September 25, 2026
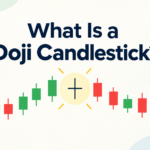
What Is a Doji Candlestick? A Doji candlestick appears like a plus sign or a cross on stock charts. If you've seen one, that's what it is. In simple terms, a Doji candlestick forms when the open and close prices of a stock are almost the same. It shows a tug-of-war between buyers and sellers, where neither side wins clearly. The Doji is a key candlestick pattern for beginners to learn. Doji Candlestick Meaning The word "Doji" comes from Japanese, and it roughly means "mistake" or "the same." That's fitting because a Doji candle shows a moment when the market couldn't decide which way to go. Think of it as a rope-pulling contest. Buyers pull one way, while sellers pull the other. By the end of the session, both sides are nearly back where they began. That's the core Doji pattern meaning for beginners. How a Doji Candle Forms (Open and Close Prices) Every candlestick has four price points: open, high, low, and close. In a normal candle, the open and close prices differ quite a bit, which gives the candle a thick body. In a Doji candlestick, the open and close prices are nearly equal. This forms a thin or nearly invisible body. Wicks, or shadows, extend above and below. Those wicks show how much the price moved during the session. Then, it returned close to the opening level. Main Types of Doji Patterns Not all Doji candles look the same. Here are the main types every trader should recognize: Standard/Neutral Doji: Small wicks on both sides, showing balanced indecision Long-Legged Doji: This candle has long wicks on both sides. It shows that the price moved a lot but closed close to the open. This shows strong trading indecision Dragonfly Doji: Looks like a "T". The long lower wick shows sellers pushed the price down, but buyers pulled it back up by close. Often seen near the bottom of a downtrend Gravestone Doji: Looks like an upside-down "T". A long upper wick shows buyers pushed the price up, but sellers dragged it back down. Often seen near the top of an uptrend What Does a Doji Tell Traders? (Indecision & Reversal Signals) A Doji pattern mainly signals one thing: uncertainty. Neither buyers nor sellers have full control during that session. A Doji after a strong trend is important. It can signal a possible reversal pattern. This means the current trend may be losing power and could change direction. A Dragonfly Doji that appears after a downtrend can signal a bullish reversal. In contrast, a Gravestone Doji after an uptrend may signal a bearish trend. But here's the honest part: a single Doji candle doesn't confirm anything on its own. It's a warning sign, not a certainty. How to Use Doji Candlestick in Trading (With Caution) To read Doji candlestick patterns well, don't rely on the candles; always use other tools too. Check the trend before and after the doji Look at support and resistance levels nearby Confirm with volume since a Doji on high volume carries more weight Wait for the next candle to confirm the direction It is like reading one line of a book. You can get hints, but not the full story. Doji Candlestick in the Indian Stock Market Context Doji candles frequently appear for Indian traders on the NSE and BSE. This is especially true during results season or major news events. These times bring more uncertainty to the market. Many beginners in the Indian stock market feel excited when they spot a Doji candlestick. They often expect an immediate reversal. That's a common mistake. Experienced traders treat it as one piece of the puzzle, not the whole picture. If you're new, start by finding Doji patterns on index charts like Nifty or Bank Nifty. Watch what happens after they form, and note how price reacts near key levels. Over time, this pattern recognition becomes second nature. A Doji candlestick is important for beginners. It boosts confidence in reading price charts. This knowledge can lead to better trading decisions.
What Is a Doji Candlestick?
September 24, 2026
Follow Us
Subscribe
Home/Stock Market/IPO Oversubscription: Meaning, 5 Reasons and What Happens to Your Allotment
Stock Market

IPO Oversubscription: Meaning, 5 Reasons and What Happens to Your Allotment

IPO oversubscription happens when investors apply for more shares than the company has offered in its public issue. If a company offers 50 lakh shares and receives bids for 150 lakh, the issue is...


Suhani
Suhani
September 30, 2026 5 Min Read
111 0
IPO Oversubscription

IPO oversubscription happens when investors apply for more shares than the company has offered in its public issue. If a company offers 50 lakh shares and receives bids for 150 lakh, the issue is subscribed three times. Buyers outnumber the shares on sale, so the registrar has to decide who gets what under SEBI’s rules.

Table Of Content

  • What Does IPO Oversubscription Mean?
  • Why Do IPOs Get Oversubscribed?
  • What Happens When an IPO Is Oversubscribed?
  • How Does IPO Allotment Work?
  • What Happens If You Don’t Get the Shares?
  • Does an Oversubscribed IPO Guarantee Listing Gains?
  • Frequently Asked Questions

In an oversubscribed IPO, many applicants end up with fewer shares than they bid for, or none at all.

What Does IPO Oversubscription Mean?

The IPO oversubscription meaning comes down to one ratio: shares applied for divided by shares offered. Anything above 1× means demand exceeded supply. Anything below 1× means the issue was undersubscribed.

TermMeaning
Shares offeredShares the company puts up for sale in the IPO
Shares applied forTotal shares investors bid for
Subscription rateShares applied for ÷ shares offered
AllotmentShares actually assigned to each applicant

That ratio is the practical IPO subscription meaning. A 2× subscription means bids for two shares for every one available. If an IPO is subscribed 10 times, bids came in for ten shares for every share on offer, so at most about one-tenth of the demand can be met.

Subscription is reported for the whole issue and also by investor category: retail, non-institutional investors (NII) and qualified institutional buyers (QIB). An issue can be 3× overall but 20× in one category, and allotment depends on the category’s own number.

Why Do IPOs Get Oversubscribed?

There is rarely a single cause. When investors ask why an IPO is oversubscribed, these five factors usually explain it:

  1. Strong fundamentals and growth prospects. Consistent revenue, healthy margins, a clear business model and a credible growth plan attract interest. The RHP (red herring prospectus) is where investors check these.
  1. Reasonable pricing. Investors compare the price band with the valuations of listed peers. If the issue looks fairly priced or cheap, more people apply.
  1. Positive market sentiment. In a rising market with plenty of liquidity, investors are more willing to take up new issues. Weak markets tend to produce lukewarm subscription.
  1. Institutional backing. Anchor investors and large funds signal confidence, and other investors often follow. The reputation of the lead managers can also affect how much attention an issue gets.
  1. Small issue size and listing-gain expectations. When a limited number of shares chases wide interest, subscription multiples climb. That is why SME issues often record far higher multiples than large mainboard IPOs. Expectations of a strong debut push demand further, though those expectations can turn out wrong.

What Happens When an IPO Is Oversubscribed?

The company does not simply sell more shares to satisfy everyone. The shares on offer are fixed, and in any oversubscribed IPO they are distributed by category.

For a book-built mainboard issue, the net offer is split roughly like this:

  • Retail investors (bids up to ₹2 lakh): not less than 35%
  • NII (bids above ₹2 lakh): not less than 15%
  • QIBs (mutual funds, insurers and other institutions): up to 50%

A category that is undersubscribed can sometimes be topped up from another, but a QIB shortfall generally cannot be filled by retail or NII demand.

Allotment inside each category then follows its own method. Retail IPO allotment goes through a computerised draw when the category is oversubscribed. NII and QIB allotments are generally proportionate to the bids made.

How Does IPO Allotment Work?

The IPO allotment process runs on a fixed timeline that SEBI has enforced since December 2023. Here T is the day the issue closes:

  1. T: Bidding closes, and the registrar collects all valid applications.
  2. T+1: The registrar, exchange, and lead manager finalise the basis of allotment.
  3. T+2: Shares are credited to the demat accounts of allottees, and blocked funds are released for everyone else.
  4. T+3: The shares are listed on the exchange.

Simple flow: IPO closes → Applications processed → Allotment finalised → Shares credited / funds unblocked → Listing.

Retail IPO allotment in a heavily bid issue is less intuitive than it looks. The registrar first tries to give every valid bidder at least one lot. If there are more bidders than lots, a draw decides who gets them. Only one application per PAN is allowed, and bidding for more lots does not improve your chances in the retail category.

What Happens If You Don’t Get the Shares?

You lose nothing except the wait. IPO bids in India run through ASBA (Application Supported by Blocked Amount), so the money stays in your account. It is only blocked, not debited. If you receive no allotment, the bank lifts the block, generally by T+2. That release is the final stage of the IPO allotment process for unsuccessful applicants.

If you get a partial allotment, only the amount for the shares you received is debited. The excess block is released.

You can check your IPO allotment status on the registrar’s website, or on BSE or NSE, using your PAN or application number. The IPO allotment status usually appears late on T+1 or early on T+2. If your status shows “not allotted” and the block has not been lifted on time, contact your broker or bank first, then escalate through SEBI’s SCORES portal.

Does an Oversubscribed IPO Guarantee Listing Gains?

No. Four terms are often mixed up:

  • Oversubscription shows demand during the bidding window.
  • Allotment decides whether you actually receive shares.
  • Listing price is set by the market when trading begins, not by the company.
  • Listing gain is the difference between the listing price and the issue price.

An oversubscribed IPO often lists at a premium, since investors who missed out may buy in the market. But a strong subscription only reflects demand before listing. Before applying based on subscription numbers or listing expectations, investors should understand the common IPO mistakes to avoid.

Frequently Asked Questions

What happens if an IPO is subscribed 10 times?

Applications total ten times the shares available. Allotment follows category rules, so many applicants receive fewer shares than they applied for, or none.

Do investors get all the shares they apply for?

Not in an oversubscribed issue. Selected retail applicants typically get at least one lot, while NII and QIB allotments are scaled down in proportion to their bids.

How long does the IPO allotment process take?

Under SEBI’s T+3 timeline, allotment is finalised on T+1, shares are credited or funds are unblocked on T+2, and listing happens on T+3.

Does IPO oversubscription guarantee listing gains?

No. It signals demand, but the listing price depends on market conditions on the day and can fall below the issue price.





Share Article

Suhani

Suhani Content Writer

Suhani is a skilled finance content writer dedicated to creating insightful, engaging, and reader-focused content. With a deep understanding of personal finance, investments, market trends, and financial planning, Suhani excels at turning complex financial topics into simple, actionable insights. From demystifying tax strategies to exploring smart investment options, Suhani provides readers with the knowledge they need to achieve financial success. Known for a professional yet approachable writing style, Suhani blends research, clarity, and creativity to craft content that resonates with diverse audiences. Trusted by clients and readers alike, Suhani is your go-to expert for finance content.

Turnaround Stocks
Previous Post

What Is a Turnaround Stock?

Top Authors
Suhani
SuhaniContent Writer
101 Posts
Manaswi Agarwal
Manaswi AgarwalContent Writer (Finance, Stock market)
50 Posts
Top Categories
Stockmarket Simplified Stockmarket Simplified
50 Posts
Glossary Glossary
59 Posts
Most Viewed
SME IPO Risks
9 SME IPO Risks to Know Before You Invest 
September 26, 2026
portfolio rebalancing
What Is Portfolio Rebalancing?
September 25, 2026
What Is a Doji Candlestick? A Doji candlestick appears like a plus sign or a cross on stock charts. If you've seen one, that's what it is. In simple terms, a Doji candlestick forms when the open and close prices of a stock are almost the same. It shows a tug-of-war between buyers and sellers, where neither side wins clearly. The Doji is a key candlestick pattern for beginners to learn. Doji Candlestick Meaning The word "Doji" comes from Japanese, and it roughly means "mistake" or "the same." That's fitting because a Doji candle shows a moment when the market couldn't decide which way to go. Think of it as a rope-pulling contest. Buyers pull one way, while sellers pull the other. By the end of the session, both sides are nearly back where they began. That's the core Doji pattern meaning for beginners. How a Doji Candle Forms (Open and Close Prices) Every candlestick has four price points: open, high, low, and close. In a normal candle, the open and close prices differ quite a bit, which gives the candle a thick body. In a Doji candlestick, the open and close prices are nearly equal. This forms a thin or nearly invisible body. Wicks, or shadows, extend above and below. Those wicks show how much the price moved during the session. Then, it returned close to the opening level. Main Types of Doji Patterns Not all Doji candles look the same. Here are the main types every trader should recognize: Standard/Neutral Doji: Small wicks on both sides, showing balanced indecision Long-Legged Doji: This candle has long wicks on both sides. It shows that the price moved a lot but closed close to the open. This shows strong trading indecision Dragonfly Doji: Looks like a "T". The long lower wick shows sellers pushed the price down, but buyers pulled it back up by close. Often seen near the bottom of a downtrend Gravestone Doji: Looks like an upside-down "T". A long upper wick shows buyers pushed the price up, but sellers dragged it back down. Often seen near the top of an uptrend What Does a Doji Tell Traders? (Indecision & Reversal Signals) A Doji pattern mainly signals one thing: uncertainty. Neither buyers nor sellers have full control during that session. A Doji after a strong trend is important. It can signal a possible reversal pattern. This means the current trend may be losing power and could change direction. A Dragonfly Doji that appears after a downtrend can signal a bullish reversal. In contrast, a Gravestone Doji after an uptrend may signal a bearish trend. But here's the honest part: a single Doji candle doesn't confirm anything on its own. It's a warning sign, not a certainty. How to Use Doji Candlestick in Trading (With Caution) To read Doji candlestick patterns well, don't rely on the candles; always use other tools too. Check the trend before and after the doji Look at support and resistance levels nearby Confirm with volume since a Doji on high volume carries more weight Wait for the next candle to confirm the direction It is like reading one line of a book. You can get hints, but not the full story. Doji Candlestick in the Indian Stock Market Context Doji candles frequently appear for Indian traders on the NSE and BSE. This is especially true during results season or major news events. These times bring more uncertainty to the market. Many beginners in the Indian stock market feel excited when they spot a Doji candlestick. They often expect an immediate reversal. That's a common mistake. Experienced traders treat it as one piece of the puzzle, not the whole picture. If you're new, start by finding Doji patterns on index charts like Nifty or Bank Nifty. Watch what happens after they form, and note how price reacts near key levels. Over time, this pattern recognition becomes second nature. A Doji candlestick is important for beginners. It boosts confidence in reading price charts. This knowledge can lead to better trading decisions.
What Is a Doji Candlestick?
September 24, 2026

Related Posts

IPO Oversubscription
Stock Market
IPO Oversubscription: Meaning, 5 Reasons and What Happens to Your Allotment
Suhani
By Suhani
SME IPO Risks
Stock Market
9 SME IPO Risks to Know Before You Invest 
Suhani
By Suhani
Primary Market vs Secondary Market
Stock Market
Primary Market vs Secondary Market: Key Differences 
Suhani
By Suhani
Hedging in the Stock Market
Stock Market
What is Hedging in the Stock Market?
Suhani
By Suhani
instagram image
instagram image
instagram image
instagram image
instagram image
instagram image
Instagram
stockmarketsimplified stockmarketsimplified
  • contact@stockmarketsimplified.com
Helpful Links
  • Glossary
  • Contact
  • Privacy Policy
  • Terms And Conditions
Popular Posts
IPO Oversubscription: Meaning, 5 Reasons and What Happens to Your Allotment
Suhani
September 30, 2026
What Is a Turnaround Stock?
Suhani
September 29, 2026
What Is Concentration Risk? 
Suhani
September 28, 2026
Follow Us
Facebook
Twitter
Youtube
Instagram
Stay Informed
©Copyright 2026. stockmarketsimplified.com. All Rights Reserved