


• contact@stockmarketsimplified.com
stockmarketsimplified stockmarketsimplified
  • Home
  • Glossary
  • Contact
Search the Site
Popular Searches:
iPhone Artificial Intelligence Smartphones
Recent Posts
Concentration Risk
What Is Concentration Risk? 
September 28, 2026
implied volatility
What Is Implied Volatility?
September 27, 2026
SME IPO Risks
9 SME IPO Risks to Know Before You Invest 
September 26, 2026
stockmarketsimplified stockmarketsimplified
  • Home
  • Glossary
  • Contact
Popular News
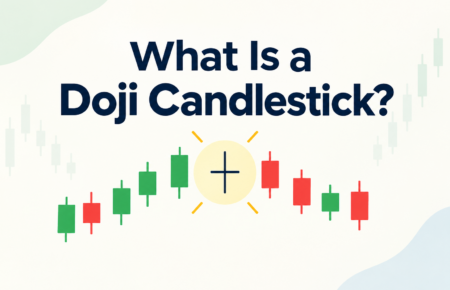
What Is a Doji Candlestick? A Doji candlestick appears like a plus sign or a cross on stock charts. If you've seen one, that's what it is. In simple terms, a Doji candlestick forms when the open and close prices of a stock are almost the same. It shows a tug-of-war between buyers and sellers, where neither side wins clearly. The Doji is a key candlestick pattern for beginners to learn. Doji Candlestick Meaning The word "Doji" comes from Japanese, and it roughly means "mistake" or "the same." That's fitting because a Doji candle shows a moment when the market couldn't decide which way to go. Think of it as a rope-pulling contest. Buyers pull one way, while sellers pull the other. By the end of the session, both sides are nearly back where they began. That's the core Doji pattern meaning for beginners. How a Doji Candle Forms (Open and Close Prices) Every candlestick has four price points: open, high, low, and close. In a normal candle, the open and close prices differ quite a bit, which gives the candle a thick body. In a Doji candlestick, the open and close prices are nearly equal. This forms a thin or nearly invisible body. Wicks, or shadows, extend above and below. Those wicks show how much the price moved during the session. Then, it returned close to the opening level. Main Types of Doji Patterns Not all Doji candles look the same. Here are the main types every trader should recognize: Standard/Neutral Doji: Small wicks on both sides, showing balanced indecision Long-Legged Doji: This candle has long wicks on both sides. It shows that the price moved a lot but closed close to the open. This shows strong trading indecision Dragonfly Doji: Looks like a "T". The long lower wick shows sellers pushed the price down, but buyers pulled it back up by close. Often seen near the bottom of a downtrend Gravestone Doji: Looks like an upside-down "T". A long upper wick shows buyers pushed the price up, but sellers dragged it back down. Often seen near the top of an uptrend What Does a Doji Tell Traders? (Indecision & Reversal Signals) A Doji pattern mainly signals one thing: uncertainty. Neither buyers nor sellers have full control during that session. A Doji after a strong trend is important. It can signal a possible reversal pattern. This means the current trend may be losing power and could change direction. A Dragonfly Doji that appears after a downtrend can signal a bullish reversal. In contrast, a Gravestone Doji after an uptrend may signal a bearish trend. But here's the honest part: a single Doji candle doesn't confirm anything on its own. It's a warning sign, not a certainty. How to Use Doji Candlestick in Trading (With Caution) To read Doji candlestick patterns well, don't rely on the candles; always use other tools too. Check the trend before and after the doji Look at support and resistance levels nearby Confirm with volume since a Doji on high volume carries more weight Wait for the next candle to confirm the direction It is like reading one line of a book. You can get hints, but not the full story. Doji Candlestick in the Indian Stock Market Context Doji candles frequently appear for Indian traders on the NSE and BSE. This is especially true during results season or major news events. These times bring more uncertainty to the market. Many beginners in the Indian stock market feel excited when they spot a Doji candlestick. They often expect an immediate reversal. That's a common mistake. Experienced traders treat it as one piece of the puzzle, not the whole picture. If you're new, start by finding Doji patterns on index charts like Nifty or Bank Nifty. Watch what happens after they form, and note how price reacts near key levels. Over time, this pattern recognition becomes second nature. A Doji candlestick is important for beginners. It boosts confidence in reading price charts. This knowledge can lead to better trading decisions.
What Is a Doji Candlestick?
September 24, 2026
Portfolio Diversification
What Is Portfolio Diversification?
September 23, 2026
What is hedging in the stock market
What Is Hedging in the Stock Market? 
September 22, 2026
Follow Us
Subscribe
Home/Glossary/What Is Concentration Risk? 
Glossary

What Is Concentration Risk? 

Concentration risk is what happens when you put too much money into one place. One stock, one sector, one fund, one idea. It feels fine until that one thing turns against you, and suddenly your whole...

Suhani
Suhani
September 28, 2026 3 Min Read
9 0
Concentration Risk

Concentration risk is what happens when you put too much money into one place. One stock, one sector, one fund, one idea. It feels fine until that one thing turns against you, and suddenly your whole portfolio feels the pain at once.

Table Of Content

  • Common Types of Concentration Risk
  • Real-Life Example 
  • How to Reduce Concentration Risk in Your Portfolio
  • Why Understanding Concentration Risk Matters for Indian Investors

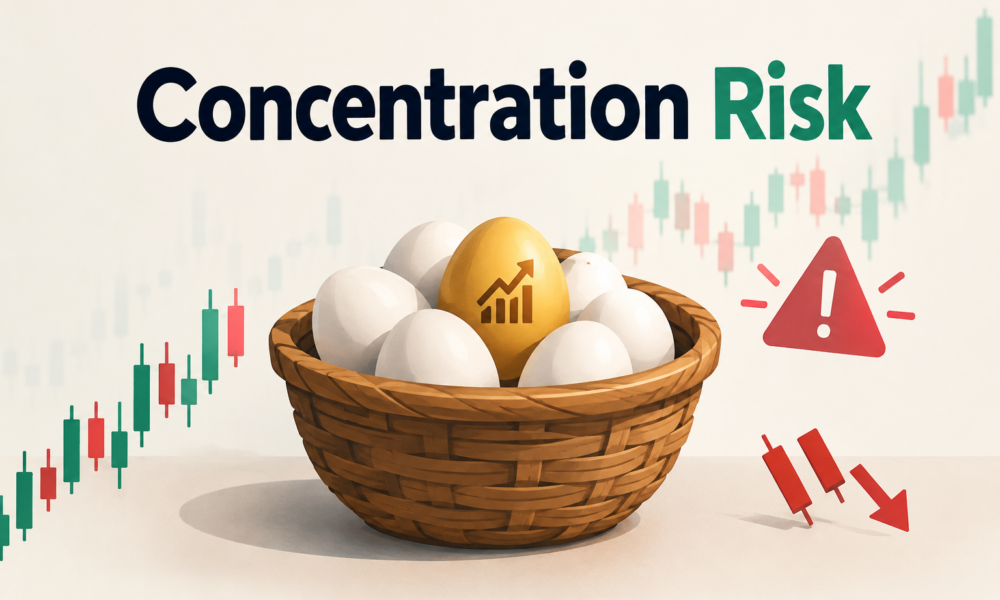
Think of the old advice your grandmother probably gave you about eggs and baskets. If you carry all your eggs in a single basket and it slips, you lose everything in one go. Investing works the same way. When your money is spread out, one bad basket does not ruin your morning.

In investing terms, it means your returns depend too heavily on a small number of holdings. It is not about being reckless on purpose. Most investors slide into it slowly, buying more of what already did well, until one bet becomes half their portfolio.

Common Types of Concentration Risk

  • Single-stock risk: holding a large chunk of your money in one company, maybe because you work there or you love the brand
  • Sector concentration risk: loading up on IT stocks during a good year, or piling into pharma because everyone is talking about it
  • Asset-class risk: keeping almost everything in equity with nothing in debt, gold, or cash
  • Geography risk: investing only in Indian markets with zero exposure elsewhere
  • Mutual fund overlap: owning five different mutual funds that all secretly hold the same top ten stocks

A classic Indian example is an investor who keeps adding to IT stocks because the sector had a great run for two years, without realising how exposed they have become.

Real-Life Example 

Ramesh, a software engineer in Pune, put nearly 65% of his savings into his own company’s stock and a couple of other IT names he liked. For a while, his portfolio looked brilliant on paper. Then a global slowdown hit the IT sector hard, and his portfolio fell almost 40% in under a year. This concentration risk example shows how one sector’s bad phase can undo years of saving.

How to Reduce Concentration Risk in Your Portfolio

  1. Spread your money across sectors instead of chasing whichever one is hot right now
  2. Mix asset classes: some equity, some debt, a little gold, and enough cash for emergencies
  3. Use index funds or diversified mutual funds so no single stock can sink your whole plan
  4. Rebalance your portfolio every six to twelve months so no single holding grows too large
  5. Check for mutual fund overlap before buying a new fund, since many schemes hold similar large-cap names
  6. Set a personal cap, such as keeping any single stock below 8% to 10% of your portfolio, if that fits your risk tolerance and investment plan.

These steps around how to reduce concentration risk are not complicated. They just need consistency, not genius.

Why Understanding Concentration Risk Matters for Indian Investors

Indian markets move in cycles. IT looks unstoppable for two years, then banking takes over, then pharma has its moment, then it is someone else’s turn. If your money is stuck in whichever sector just finished its run, you end up buying high and holding through the fall.

This is also why portfolio diversification and concentration risk get discussed together so often. Portfolio diversification is not about diluting your returns for no reason. SEBI’s investor guidance on managing investment risk also highlights diversification across different asset classes and within an asset category.

For long-term wealth, protecting your downside matters just as much as chasing upside. A portfolio built without concentration risk in mind can survive market cycles that would otherwise wipe out an overconfident, concentrated bet.

At the end of the day, it is simple to understand and just as simple to manage, once you decide to do something about it. Spread your bets, review them regularly, and do not let one good year convince you that one stock or sector is a sure thing. Smart investing is not about chasing the hottest stock; it is about protecting your capital when markets turn.

Share Article

Suhani

Suhani Content Writer

Suhani is a skilled finance content writer dedicated to creating insightful, engaging, and reader-focused content. With a deep understanding of personal finance, investments, market trends, and financial planning, Suhani excels at turning complex financial topics into simple, actionable insights. From demystifying tax strategies to exploring smart investment options, Suhani provides readers with the knowledge they need to achieve financial success. Known for a professional yet approachable writing style, Suhani blends research, clarity, and creativity to craft content that resonates with diverse audiences. Trusted by clients and readers alike, Suhani is your go-to expert for finance content.

implied volatility
Previous Post

What Is Implied Volatility?

Top Authors
Suhani
SuhaniContent Writer
99 Posts
Manaswi Agarwal
Manaswi AgarwalContent Writer (Finance, Stock market)
50 Posts
Top Categories
Stockmarket Simplified Stockmarket Simplified
50 Posts
Glossary Glossary
58 Posts
Most Viewed
What Is a Doji Candlestick? A Doji candlestick appears like a plus sign or a cross on stock charts. If you've seen one, that's what it is. In simple terms, a Doji candlestick forms when the open and close prices of a stock are almost the same. It shows a tug-of-war between buyers and sellers, where neither side wins clearly. The Doji is a key candlestick pattern for beginners to learn. Doji Candlestick Meaning The word "Doji" comes from Japanese, and it roughly means "mistake" or "the same." That's fitting because a Doji candle shows a moment when the market couldn't decide which way to go. Think of it as a rope-pulling contest. Buyers pull one way, while sellers pull the other. By the end of the session, both sides are nearly back where they began. That's the core Doji pattern meaning for beginners. How a Doji Candle Forms (Open and Close Prices) Every candlestick has four price points: open, high, low, and close. In a normal candle, the open and close prices differ quite a bit, which gives the candle a thick body. In a Doji candlestick, the open and close prices are nearly equal. This forms a thin or nearly invisible body. Wicks, or shadows, extend above and below. Those wicks show how much the price moved during the session. Then, it returned close to the opening level. Main Types of Doji Patterns Not all Doji candles look the same. Here are the main types every trader should recognize: Standard/Neutral Doji: Small wicks on both sides, showing balanced indecision Long-Legged Doji: This candle has long wicks on both sides. It shows that the price moved a lot but closed close to the open. This shows strong trading indecision Dragonfly Doji: Looks like a "T". The long lower wick shows sellers pushed the price down, but buyers pulled it back up by close. Often seen near the bottom of a downtrend Gravestone Doji: Looks like an upside-down "T". A long upper wick shows buyers pushed the price up, but sellers dragged it back down. Often seen near the top of an uptrend What Does a Doji Tell Traders? (Indecision & Reversal Signals) A Doji pattern mainly signals one thing: uncertainty. Neither buyers nor sellers have full control during that session. A Doji after a strong trend is important. It can signal a possible reversal pattern. This means the current trend may be losing power and could change direction. A Dragonfly Doji that appears after a downtrend can signal a bullish reversal. In contrast, a Gravestone Doji after an uptrend may signal a bearish trend. But here's the honest part: a single Doji candle doesn't confirm anything on its own. It's a warning sign, not a certainty. How to Use Doji Candlestick in Trading (With Caution) To read Doji candlestick patterns well, don't rely on the candles; always use other tools too. Check the trend before and after the doji Look at support and resistance levels nearby Confirm with volume since a Doji on high volume carries more weight Wait for the next candle to confirm the direction It is like reading one line of a book. You can get hints, but not the full story. Doji Candlestick in the Indian Stock Market Context Doji candles frequently appear for Indian traders on the NSE and BSE. This is especially true during results season or major news events. These times bring more uncertainty to the market. Many beginners in the Indian stock market feel excited when they spot a Doji candlestick. They often expect an immediate reversal. That's a common mistake. Experienced traders treat it as one piece of the puzzle, not the whole picture. If you're new, start by finding Doji patterns on index charts like Nifty or Bank Nifty. Watch what happens after they form, and note how price reacts near key levels. Over time, this pattern recognition becomes second nature. A Doji candlestick is important for beginners. It boosts confidence in reading price charts. This knowledge can lead to better trading decisions.
What Is a Doji Candlestick?
September 24, 2026
Portfolio Diversification
What Is Portfolio Diversification?
September 23, 2026
What is hedging in the stock market
What Is Hedging in the Stock Market? 
September 22, 2026

Related Posts

Concentration Risk
Glossary
What Is Concentration Risk? 
Suhani
By Suhani
implied volatility
Glossary
What Is Implied Volatility?
Suhani
By Suhani
portfolio rebalancing
Glossary
What Is Portfolio Rebalancing?
Suhani
By Suhani
What Is a Doji Candlestick? A Doji candlestick appears like a plus sign or a cross on stock charts. If you've seen one, that's what it is. In simple terms, a Doji candlestick forms when the open and close prices of a stock are almost the same. It shows a tug-of-war between buyers and sellers, where neither side wins clearly. The Doji is a key candlestick pattern for beginners to learn. Doji Candlestick Meaning The word "Doji" comes from Japanese, and it roughly means "mistake" or "the same." That's fitting because a Doji candle shows a moment when the market couldn't decide which way to go. Think of it as a rope-pulling contest. Buyers pull one way, while sellers pull the other. By the end of the session, both sides are nearly back where they began. That's the core Doji pattern meaning for beginners. How a Doji Candle Forms (Open and Close Prices) Every candlestick has four price points: open, high, low, and close. In a normal candle, the open and close prices differ quite a bit, which gives the candle a thick body. In a Doji candlestick, the open and close prices are nearly equal. This forms a thin or nearly invisible body. Wicks, or shadows, extend above and below. Those wicks show how much the price moved during the session. Then, it returned close to the opening level. Main Types of Doji Patterns Not all Doji candles look the same. Here are the main types every trader should recognize: Standard/Neutral Doji: Small wicks on both sides, showing balanced indecision Long-Legged Doji: This candle has long wicks on both sides. It shows that the price moved a lot but closed close to the open. This shows strong trading indecision Dragonfly Doji: Looks like a "T". The long lower wick shows sellers pushed the price down, but buyers pulled it back up by close. Often seen near the bottom of a downtrend Gravestone Doji: Looks like an upside-down "T". A long upper wick shows buyers pushed the price up, but sellers dragged it back down. Often seen near the top of an uptrend What Does a Doji Tell Traders? (Indecision & Reversal Signals) A Doji pattern mainly signals one thing: uncertainty. Neither buyers nor sellers have full control during that session. A Doji after a strong trend is important. It can signal a possible reversal pattern. This means the current trend may be losing power and could change direction. A Dragonfly Doji that appears after a downtrend can signal a bullish reversal. In contrast, a Gravestone Doji after an uptrend may signal a bearish trend. But here's the honest part: a single Doji candle doesn't confirm anything on its own. It's a warning sign, not a certainty. How to Use Doji Candlestick in Trading (With Caution) To read Doji candlestick patterns well, don't rely on the candles; always use other tools too. Check the trend before and after the doji Look at support and resistance levels nearby Confirm with volume since a Doji on high volume carries more weight Wait for the next candle to confirm the direction It is like reading one line of a book. You can get hints, but not the full story. Doji Candlestick in the Indian Stock Market Context Doji candles frequently appear for Indian traders on the NSE and BSE. This is especially true during results season or major news events. These times bring more uncertainty to the market. Many beginners in the Indian stock market feel excited when they spot a Doji candlestick. They often expect an immediate reversal. That's a common mistake. Experienced traders treat it as one piece of the puzzle, not the whole picture. If you're new, start by finding Doji patterns on index charts like Nifty or Bank Nifty. Watch what happens after they form, and note how price reacts near key levels. Over time, this pattern recognition becomes second nature. A Doji candlestick is important for beginners. It boosts confidence in reading price charts. This knowledge can lead to better trading decisions.
Glossary
What Is a Doji Candlestick?
Suhani
By Suhani
instagram image
instagram image
instagram image
instagram image
instagram image
instagram image
Instagram
stockmarketsimplified stockmarketsimplified
  • contact@stockmarketsimplified.com
Helpful Links
  • Glossary
  • Contact
  • Privacy Policy
  • Terms And Conditions
Popular Posts
What Is Concentration Risk? 
Suhani
September 28, 2026
What Is Implied Volatility?
Suhani
September 27, 2026
9 SME IPO Risks to Know Before You Invest 
Suhani
September 26, 2026
Follow Us
Facebook
Twitter
Youtube
Instagram
Stay Informed
©Copyright 2026. stockmarketsimplified.com. All Rights Reserved