




• contact@stockmarketsimplified.com
stockmarketsimplified stockmarketsimplified
  • Home
  • Glossary
  • Contact
Search the Site
Popular Searches:
iPhone Artificial Intelligence Smartphones
Recent Posts
IPO Oversubscription
IPO Oversubscription: Meaning, 5 Reasons and What Happens to Your Allotment
September 30, 2026
Turnaround Stocks
What Is a Turnaround Stock?
September 29, 2026
Concentration Risk
What Is Concentration Risk? 
September 28, 2026
stockmarketsimplified stockmarketsimplified
  • Home
  • Glossary
  • Contact
Popular News
SME IPO Risks
9 SME IPO Risks to Know Before You Invest 
September 26, 2026
portfolio rebalancing
What Is Portfolio Rebalancing?
September 25, 2026
What Is a Doji Candlestick? A Doji candlestick appears like a plus sign or a cross on stock charts. If you've seen one, that's what it is. In simple terms, a Doji candlestick forms when the open and close prices of a stock are almost the same. It shows a tug-of-war between buyers and sellers, where neither side wins clearly. The Doji is a key candlestick pattern for beginners to learn. Doji Candlestick Meaning The word "Doji" comes from Japanese, and it roughly means "mistake" or "the same." That's fitting because a Doji candle shows a moment when the market couldn't decide which way to go. Think of it as a rope-pulling contest. Buyers pull one way, while sellers pull the other. By the end of the session, both sides are nearly back where they began. That's the core Doji pattern meaning for beginners. How a Doji Candle Forms (Open and Close Prices) Every candlestick has four price points: open, high, low, and close. In a normal candle, the open and close prices differ quite a bit, which gives the candle a thick body. In a Doji candlestick, the open and close prices are nearly equal. This forms a thin or nearly invisible body. Wicks, or shadows, extend above and below. Those wicks show how much the price moved during the session. Then, it returned close to the opening level. Main Types of Doji Patterns Not all Doji candles look the same. Here are the main types every trader should recognize: Standard/Neutral Doji: Small wicks on both sides, showing balanced indecision Long-Legged Doji: This candle has long wicks on both sides. It shows that the price moved a lot but closed close to the open. This shows strong trading indecision Dragonfly Doji: Looks like a "T". The long lower wick shows sellers pushed the price down, but buyers pulled it back up by close. Often seen near the bottom of a downtrend Gravestone Doji: Looks like an upside-down "T". A long upper wick shows buyers pushed the price up, but sellers dragged it back down. Often seen near the top of an uptrend What Does a Doji Tell Traders? (Indecision & Reversal Signals) A Doji pattern mainly signals one thing: uncertainty. Neither buyers nor sellers have full control during that session. A Doji after a strong trend is important. It can signal a possible reversal pattern. This means the current trend may be losing power and could change direction. A Dragonfly Doji that appears after a downtrend can signal a bullish reversal. In contrast, a Gravestone Doji after an uptrend may signal a bearish trend. But here's the honest part: a single Doji candle doesn't confirm anything on its own. It's a warning sign, not a certainty. How to Use Doji Candlestick in Trading (With Caution) To read Doji candlestick patterns well, don't rely on the candles; always use other tools too. Check the trend before and after the doji Look at support and resistance levels nearby Confirm with volume since a Doji on high volume carries more weight Wait for the next candle to confirm the direction It is like reading one line of a book. You can get hints, but not the full story. Doji Candlestick in the Indian Stock Market Context Doji candles frequently appear for Indian traders on the NSE and BSE. This is especially true during results season or major news events. These times bring more uncertainty to the market. Many beginners in the Indian stock market feel excited when they spot a Doji candlestick. They often expect an immediate reversal. That's a common mistake. Experienced traders treat it as one piece of the puzzle, not the whole picture. If you're new, start by finding Doji patterns on index charts like Nifty or Bank Nifty. Watch what happens after they form, and note how price reacts near key levels. Over time, this pattern recognition becomes second nature. A Doji candlestick is important for beginners. It boosts confidence in reading price charts. This knowledge can lead to better trading decisions.
What Is a Doji Candlestick?
September 24, 2026
Follow Us
Subscribe
Home/Glossary/What is Dividend Investing? 
Glossary

What is Dividend Investing? 

Ever wondered how some people earn money from stocks without selling a single share? That’s dividend investing. Simply put, you buy shares of companies that regularly distribute a portion of...

Suhani
Suhani
August 21, 2026 3 Min Read
278 0
What Is Dividend Investing?

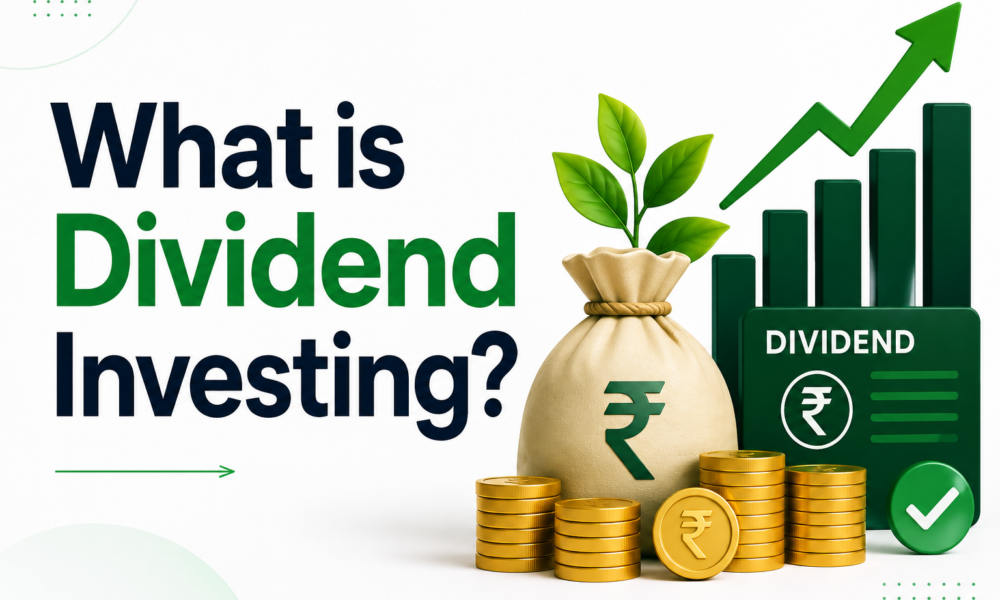
Ever wondered how some people earn money from stocks without selling a single share? That’s dividend investing. Simply put, you buy shares of companies that regularly distribute a portion of their profits to shareholders as dividends. 

Table Of Content

  • Understanding Dividend Investing in Simple Terms
  • How Does Dividend Investing Work?
  • Key Terms Every Dividend Investor Should Know
  • Benefits of Dividend Investing
  • Things to Check Before Buying Dividend Stocks
  • Dividend Investing vs Growth Investing: Which is Better?
  • Tax on Dividend Income in India (2026 Rules)
  • How to Start Dividend Investing in India
  • Final Thoughts

No timing the market, no constant screen-watching, just the potential for regular income from companies that choose to distribute dividends. 

Understanding Dividend Investing in Simple Terms

Dividend investing means picking stocks that share company profits with shareholders, usually in cash, credited to the bank account linked with your Demat account. 

This is different from growth investing, where you buy stocks hoping the share price shoots up, but the company reinvests every rupee of profit instead of paying you anything.

Indian investors love dividend investing because it gives two things together: regular income and relative stability. Retirees, conservative investors, and anyone wanting passive income from stocks find this approach comforting; it’s money in hand, not just numbers on a screen.

How Does Dividend Investing Work?

Here’s the simple version. A company earns profits, its board of directors decides whether to declare a dividend, and if approved, the dividend is credited to the bank account linked to your Demat account for eligible shareholders. 

Companies usually pay dividends quarterly, half-yearly, or annually, depending on their policy. Think of PSU giants like Coal India or Power Grid; they’re known for paying dividends consistently, almost like clockwork, rewarding loyal shareholders year after year.

Key Terms Every Dividend Investor Should Know

Before you dive in, get comfortable with these:

  • Dividend yield – the dividend amount as a percentage of the stock’s current price. Higher yield often means more income per rupee invested.
  • Dividend payout ratio – how much of total profit the company distributes as dividends versus what it keeps for growth.
  • Ex-dividend date – the cutoff date; buy the stock before this date to qualify for the upcoming dividend.
  • Dividend income – the actual cash you receive, which counts as taxable income.

Benefits of Dividend Investing

  • Steady passive income – think of dividends as your share of the company’s profit pie, arriving without you lifting a finger.
  • Lower volatility – many established dividend-paying companies tend to be less volatile than high-growth companies, although this is not guaranteed. 
  • Compounding through reinvestment – reinvest dividends to buy more shares, and your income snowballs over time.
  • Inflation hedge – companies that grow dividends over years help your income keep pace with rising costs.

Things to Check Before Buying Dividend Stocks

Don’t just chase high yield; check these first:

  • Consistent dividend history spanning 5+ years, not just one good year
  • A healthy payout ratio, not so high that it strains the company’s finances
  • Low debt levels, so dividends aren’t funded by borrowed money
  • Strong, sustainable business fundamentals behind the numbers

Dividend Investing vs Growth Investing: Which is Better?

Neither wins outright; it depends on you. Dividend investing suits conservative investors who want regular income and lower stress. Growth investing suits aggressive investors chasing higher long-term capital appreciation, even with bumpier rides along the way.

Many smart investors actually blend both for solid portfolio diversification.

Tax on Dividend Income in India (2026 Rules)

Here’s what changed and what stays the same. Dividend income is fully taxable and gets added straight to your total income, taxed as per your income tax slab rate; there’s no special flat rate.

Companies generally deduct TDS at the applicable rate if dividend payments from a single company exceed the threshold prescribed under the Income-tax Act during a financial year. If you have not furnished your PAN, TDS may be deducted at the higher applicable rate (generally 20%) under the Income-tax provisions. 

How to Start Dividend Investing in India

Getting started is easier than most people think:

  1. Open a Demat and trading account with a SEBI-registered stock broker that matches your investing needs, such as Groww, Zerodha, Angel One, or another registered broker. 
  2. Research companies with strong dividend histories and build a watchlist.
  3. Start small with 3–5 quality dividend stocks rather than spreading too thin.
  4. Reinvest your dividends regularly to let compounding do its magic.

Final Thoughts

Dividend investing isn’t about getting rich overnight; it’s about patience, consistency, and backing quality businesses. Start small, stay invested, keep learning, and let time do the heavy lifting. Long-term wealth is built quietly, one dividend at a time.


Share Article

Suhani

Suhani Content Writer

Suhani is a skilled finance content writer dedicated to creating insightful, engaging, and reader-focused content. With a deep understanding of personal finance, investments, market trends, and financial planning, Suhani excels at turning complex financial topics into simple, actionable insights. From demystifying tax strategies to exploring smart investment options, Suhani provides readers with the knowledge they need to achieve financial success. Known for a professional yet approachable writing style, Suhani blends research, clarity, and creativity to craft content that resonates with diverse audiences. Trusted by clients and readers alike, Suhani is your go-to expert for finance content.

Best MTF Brokers in India
Previous Post

Best MTF Brokers in India (2026)

SEBI MTF Rules
Next Post

SEBI MTF Rules, Eligibility & Best Practices for Margin Trading Facility

Top Authors
Suhani
SuhaniContent Writer
101 Posts
Manaswi Agarwal
Manaswi AgarwalContent Writer (Finance, Stock market)
50 Posts
Top Categories
Stockmarket Simplified Stockmarket Simplified
50 Posts
Glossary Glossary
59 Posts
Most Viewed
SME IPO Risks
9 SME IPO Risks to Know Before You Invest 
September 26, 2026
portfolio rebalancing
What Is Portfolio Rebalancing?
September 25, 2026
What Is a Doji Candlestick? A Doji candlestick appears like a plus sign or a cross on stock charts. If you've seen one, that's what it is. In simple terms, a Doji candlestick forms when the open and close prices of a stock are almost the same. It shows a tug-of-war between buyers and sellers, where neither side wins clearly. The Doji is a key candlestick pattern for beginners to learn. Doji Candlestick Meaning The word "Doji" comes from Japanese, and it roughly means "mistake" or "the same." That's fitting because a Doji candle shows a moment when the market couldn't decide which way to go. Think of it as a rope-pulling contest. Buyers pull one way, while sellers pull the other. By the end of the session, both sides are nearly back where they began. That's the core Doji pattern meaning for beginners. How a Doji Candle Forms (Open and Close Prices) Every candlestick has four price points: open, high, low, and close. In a normal candle, the open and close prices differ quite a bit, which gives the candle a thick body. In a Doji candlestick, the open and close prices are nearly equal. This forms a thin or nearly invisible body. Wicks, or shadows, extend above and below. Those wicks show how much the price moved during the session. Then, it returned close to the opening level. Main Types of Doji Patterns Not all Doji candles look the same. Here are the main types every trader should recognize: Standard/Neutral Doji: Small wicks on both sides, showing balanced indecision Long-Legged Doji: This candle has long wicks on both sides. It shows that the price moved a lot but closed close to the open. This shows strong trading indecision Dragonfly Doji: Looks like a "T". The long lower wick shows sellers pushed the price down, but buyers pulled it back up by close. Often seen near the bottom of a downtrend Gravestone Doji: Looks like an upside-down "T". A long upper wick shows buyers pushed the price up, but sellers dragged it back down. Often seen near the top of an uptrend What Does a Doji Tell Traders? (Indecision & Reversal Signals) A Doji pattern mainly signals one thing: uncertainty. Neither buyers nor sellers have full control during that session. A Doji after a strong trend is important. It can signal a possible reversal pattern. This means the current trend may be losing power and could change direction. A Dragonfly Doji that appears after a downtrend can signal a bullish reversal. In contrast, a Gravestone Doji after an uptrend may signal a bearish trend. But here's the honest part: a single Doji candle doesn't confirm anything on its own. It's a warning sign, not a certainty. How to Use Doji Candlestick in Trading (With Caution) To read Doji candlestick patterns well, don't rely on the candles; always use other tools too. Check the trend before and after the doji Look at support and resistance levels nearby Confirm with volume since a Doji on high volume carries more weight Wait for the next candle to confirm the direction It is like reading one line of a book. You can get hints, but not the full story. Doji Candlestick in the Indian Stock Market Context Doji candles frequently appear for Indian traders on the NSE and BSE. This is especially true during results season or major news events. These times bring more uncertainty to the market. Many beginners in the Indian stock market feel excited when they spot a Doji candlestick. They often expect an immediate reversal. That's a common mistake. Experienced traders treat it as one piece of the puzzle, not the whole picture. If you're new, start by finding Doji patterns on index charts like Nifty or Bank Nifty. Watch what happens after they form, and note how price reacts near key levels. Over time, this pattern recognition becomes second nature. A Doji candlestick is important for beginners. It boosts confidence in reading price charts. This knowledge can lead to better trading decisions.
What Is a Doji Candlestick?
September 24, 2026

Related Posts

Turnaround Stocks
Glossary
What Is a Turnaround Stock?
Suhani
By Suhani
Concentration Risk
Glossary
What Is Concentration Risk? 
Suhani
By Suhani
implied volatility
Glossary
What Is Implied Volatility?
Suhani
By Suhani
portfolio rebalancing
Glossary
What Is Portfolio Rebalancing?
Suhani
By Suhani
instagram image
instagram image
instagram image
instagram image
instagram image
instagram image
Instagram
stockmarketsimplified stockmarketsimplified
  • contact@stockmarketsimplified.com
Helpful Links
  • Glossary
  • Contact
  • Privacy Policy
  • Terms And Conditions
Popular Posts
IPO Oversubscription: Meaning, 5 Reasons and What Happens to Your Allotment
Suhani
September 30, 2026
What Is a Turnaround Stock?
Suhani
September 29, 2026
What Is Concentration Risk? 
Suhani
September 28, 2026
Follow Us
Facebook
Twitter
Youtube
Instagram
Stay Informed
©Copyright 2026. stockmarketsimplified.com. All Rights Reserved