




What Is a Consolidation?
What is a consolidation? It is a phase in which a stock’s price moves sideways within a fixed range instead of making a strong move up or down. Consolidation in the stock market usually reflects a...

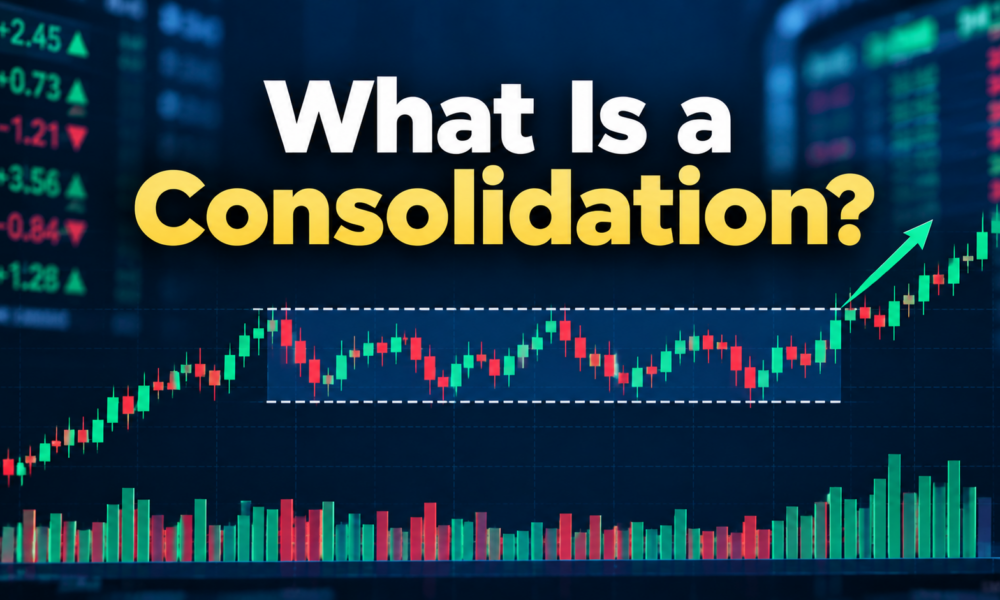
What is a consolidation? It is a phase in which a stock’s price moves sideways within a fixed range instead of making a strong move up or down. Consolidation in the stock market usually reflects a temporary balance between buyers and sellers. Neither side is strong enough to push the price in its own direction, so the market pauses. Think of it as the market taking a breath before deciding what to do next.
Table Of Content
- How Consolidation Works in Trading
- Key Signs of Price Consolidation
- Consolidation Patterns Traders Commonly See
- Breakout vs Breakdown in Consolidation
- Example of What Is a Consolidation in the Stock Market
- Why Consolidation Matters for Traders
- Consolidation vs Trend: What Is the Difference?
- Key Takeaways
How Consolidation Works in Trading
Every consolidation zone is built on support and resistance. The lower boundary of the range acts as support, where buyers tend to step in. The upper boundary acts as resistance, where sellers tend to book profits. Price keeps bouncing between these two levels until a breakout or breakdown occurs. This sideways price movement can last a few days, a few weeks, or even several months. Traders often call this a range-bound market, and the gap between the two levels is the trading range.
Key Signs of Price Consolidation
Here are the common signs of price consolidation on a chart:
- Narrow trading range
- Clear support and resistance levels
- Sideways price movement
- Lower volatility
- Reduced or uneven trading volume
- Repeated price reactions near the same levels
Volume during consolidation often dries up, which shows market indecision.
Consolidation Patterns Traders Commonly See
Not every consolidation looks the same. A few patterns appear again and again in technical analysis.
- Rectangle: Price moves between two flat, parallel lines. This is the classic consolidation pattern.
- Flag: A small, slightly tilted range that forms after a sharp move. It often shows a short pause within a larger trend.
- Pennant: Similar to a flag, but the range narrows into a small tight shape like a tiny triangle.
- Triangle: The highs and lows move closer together, squeezing the price into a smaller space.
Breakout vs Breakdown in Consolidation
A breakout happens when price moves above resistance. A breakdown happens when price falls below support. Both show that one side of the market has finally taken control.
Volume confirmation matters here. A move supported by high volume is usually taken more seriously than one on thin volume. Still, no signal works every time, and breakouts can fail.
Example of What Is a Consolidation in the Stock Market
Imagine a stock rises from ₹500 to ₹600 over a few weeks. After that, it trades between ₹580 and ₹600 for the next few weeks. It keeps failing to cross ₹600 and keeps finding buyers near ₹580.
Here, ₹580 acts as support and ₹600 acts as resistance. If the price closes above ₹600 with strong volume, it may suggest buyers are gaining control. If it closes below ₹580, it may suggest sellers are taking over. Either way, the range gives traders clear levels to watch. Until one of these levels breaks, the stock is simply in a consolidation phase.
Why Consolidation Matters for Traders
Consolidation gives traders a clear structure to work with. The range helps them identify possible entry points, place stop-loss levels just outside the boundaries, and prepare for breakout opportunities. Understanding the range also helps traders avoid chasing price in the middle of a sideways market, where moves are small and unclear.
There is a risk too. False breakouts are common, where price moves past a level, attracts traders, and then quickly returns inside the range. This is why many traders wait for confirmation before acting.
Consolidation vs Trend: What Is the Difference?
In a trend, price moves with clear direction. An uptrend makes higher highs and higher lows, while a downtrend makes lower highs and lower lows. In consolidation, price moves sideways within a range with no clear directional momentum. Trends show conviction. Consolidation shows hesitation. Most stocks move through both phases again and again.
Key Takeaways
- What is a consolidation? It is a sideways phase where price stays inside a defined range.
- Support and resistance mark the lower and upper edges of the consolidation zone.
- Patterns like rectangles, flags, pennants, and triangles are common forms of consolidation.
- A breakout or breakdown ends the range, but false moves can happen, so volume and confirmation matter.
- Consolidation is a pause, not a prediction of direction.