





What Is a Bearish Trend?
A bearish trend is a sustained downward movement in the price of an asset, sector, index, or entire market. Instead of bouncing back quickly after a dip, prices keep sliding over days, weeks, or even...

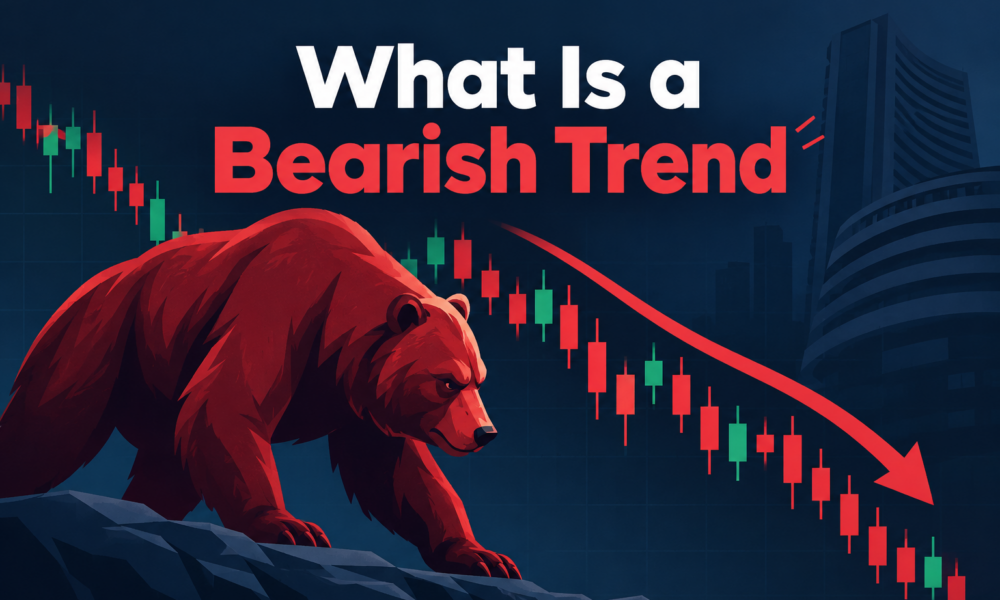
A bearish trend is a sustained downward movement in the price of an asset, sector, index, or entire market. Instead of bouncing back quickly after a dip, prices keep sliding over days, weeks, or even months.
Table Of Content
Bearish Trend Meaning
The bearish trend meaning goes beyond a simple price decline. A single red day does not make a trend. What defines it is persistence, along with a clear pattern in how the price moves.
Most bearish trends share a few traits:
- Lower highs and lower lows, where each rally fails to reach the previous peak and each drop goes deeper than the last
- Steady selling pressure that outweighs buying interest
- Weak investor confidence
- Negative market sentiment, where bad news gets more attention than good news
It helps to separate a few terms. A short-term price decline can last a day or two and mean very little. A correction is a drop of 10% or more from a recent high. A bear market is commonly defined as a fall of 20% or more. A bearish trend can show up on any timeframe, so a stock can be in a downward trend on a daily chart while the wider bearish market is still holding up.
For a deeper understanding of price trends, read this guide to identifying a downtrend on a stock chart.
How to Identify a Bearish Trend
Learning how to identify a bearish trend starts with price action. Look at the chart and ask whether peaks and troughs are both stepping downward. That pattern is the clearest bearish signal.
Technical analysis offers a few more tools:
- Moving average: when the price stays below a key average, such as the 50-day or 200-day, the trend is usually weak. A 50-day average crossing below the 200-day is called a death cross.
- Support and resistance: a bearish trend often breaks through support levels, and old support then turns into resistance.
- Trading volume: rising volume during drops suggests sellers are serious, while light volume on bounces suggests buyers lack conviction.
No single indicator is reliable on its own.
Bearish Trend vs Bullish Trend
A bullish trend is the mirror image. Prices make higher highs and higher lows, buyers stay in control, and optimism runs high. In a bearish trend, the opposite happens: sellers lead, rallies fade, and caution spreads.
The difference shows in behavior. In a bullish phase, people buy dips. In a bearish phase, they sell rallies. Both trends end eventually, but neither announces its finish clearly.
What Causes a Bearish Trend?
There is rarely just one cause. Common triggers include:
- Weak earnings that miss expectations
- Rising interest rates, which raise borrowing costs and make safer assets more attractive
- Economic uncertainty, such as slowing growth or job losses
- Geopolitical tension, including wars or trade disputes
- Negative news about a company or industry
- Reduced demand for a product or service
Once prices start falling, fear can feed on itself. Investors sell because others are selling, and the decline gains speed.
Example of a Bearish Trend
Consider the Nasdaq Composite in 2022. After peaking in late 2021, it kept making lower highs as the Federal Reserve raised interest rates to fight inflation. Growth stocks took the heaviest hits, and the index eventually fell more than 30% from its peak. Rallies appeared along the way, but each one stalled below the previous high. That is a textbook stock market downtrend.
How Traders Respond to a Bearish Trend
Responses vary, and what suits one person may not suit another. Some investors reduce exposure to risky holdings. Others place stop-loss orders to limit potential losses. Many simply wait for confirmation before making a move, rather than guessing a bottom. More experienced traders may use short selling, which means borrowing shares to sell now and buy back later at a lower price. It carries risk, since losses can be unlimited.
Whatever the approach, risk management matters most. Decide how much you can afford to lose before you act. This article is educational and not personal financial advice.
Key Takeaway
A bearish trend is a lasting downward move in prices, marked by lower highs, lower lows, falling investor confidence, and gloomy sentiment. Knowing what a bearish trend is helps you stay calm, read the chart clearly, and plan ahead instead of reacting to fear.