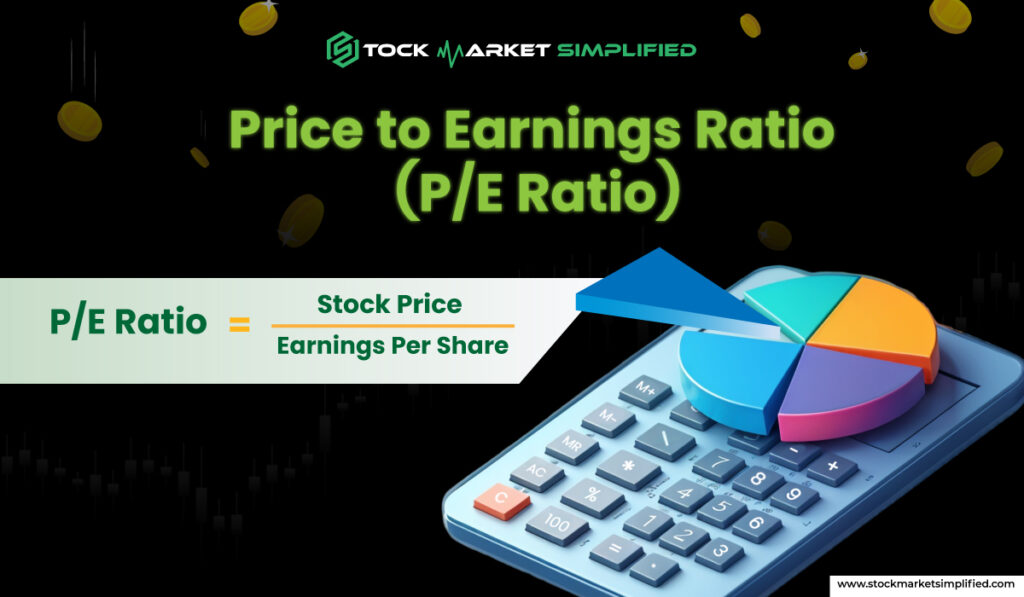
Price to Earnings Ratio (P/E Ratio)

The P/E ratio is a simple way to figure out how expensive or cheap a company’s stock is on the basis of its profits. It typically compares earnings per share (EPS) of a company with its current market price. In other words, a P/E ratio says a lot about you how much investors are ready to pay for every ₹1 the company earns.
Key Formula:
P/E Ratio = Stock Price ÷ Earnings Per Share (EPS)
What It Shows
High P/E Ratio: Means investors feel that the company can grow a lot in the future, so they’re ready to pay more for each share.
Low P/E Ratio: Hints that investors may not feel strongly confident in future growth of the company. Hence, such stocks may be cheaper.
Example:
Suppose an AB company’s stock price is ₹100. Now, let’s take ₹5 as the current EPS.
P/E Ratio of AB = ₹100 ÷ ₹5 = 20
What does it mean?
Every investor is paying an additional ₹20 for every ₹1 the company earns.
Why the P/E Ratio Matters
Mainly, P/E ratio lets investors study overvalued or undervalued stocks easily. But keep in mind:
- A high P/E doesn’t always mean the company is great.
- A low P/E doesn’t always mean the company is bad.
It’s just one tool to compare different companies.
Types of P/E Ratios
1. Trailing P/E Ratio
This looks at the company’s past earnings, usually from the last year. It shows how much you’re paying for the money the company has already made.
Formula:
Trailing P/E = Stock Price ÷ Past Earnings Per Share
2. Forward P/E Ratio
This uses future earnings estimates. Forward P/E ratio tells investors how much they are agreeing to pay potential future earnings of a company.
Formula of Forward P/E = Stock Price ÷ Projected Earnings Per Share
Why Both Types Matter
- Trailing P/E: Based on actual past performance, so it’s reliable but doesn’t show future potential.
- Forward P/E: Focuses on future predictions, which can be helpful but aren’t always accurate.
The P/E ratio, whether trailing or forward, is a handy tool for comparing stocks and making smarter investment decisions.

 Instagram


