
 Instagram


If you are a trader who wants to make it big in the stock markets, it is important for you to learn about the technical analysis tools. One of the most widely used tools is the Moving Average Convergence Divergence indicator. You can rely on this momentum indicator to understand the direction and strength of a market trend. It also shows the potential trend reversals in the stock prices.
The MACD indicator is a key metric to make informed decisions whether for an experienced trader or a beginner. In this blog, we will discuss the MACD indicator and how you can use it to maximize your profits.
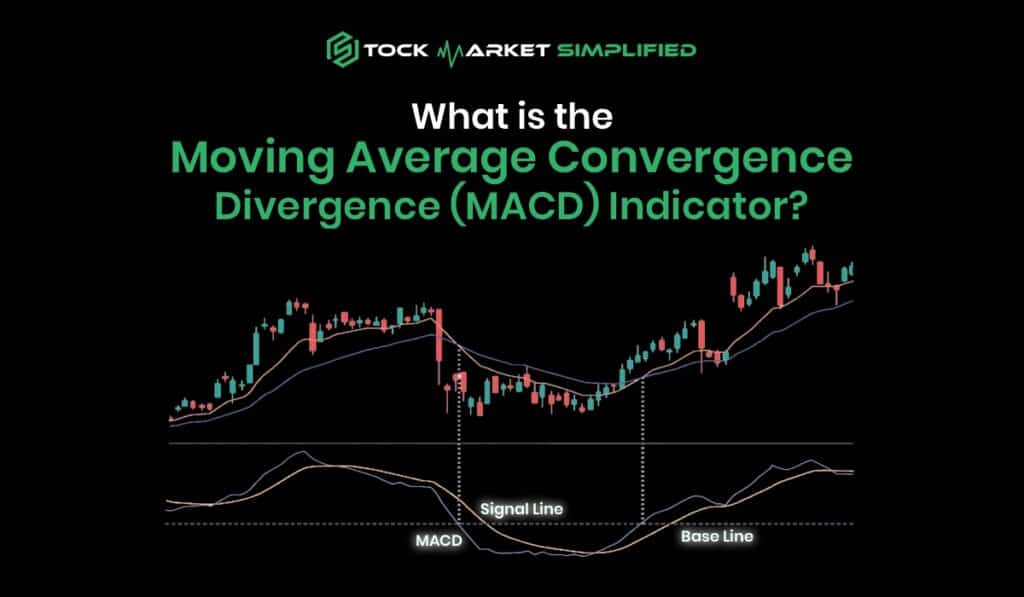
What Is the MACD Indicator?
The purpose of the MACD indicator is to help traders understand price movements by studying the momentum-based oscillation. To be specific, the Moving Average Divergence Convergence uses the relationship between 2 moving averages to calculate the price movements:
- 12-period Exponential Moving Average: It is a shorter-term, faster-moving average.
- 26-period Exponential Moving Average: It is a longer-term, slower-moving average.
Usually, the ideal period to calculate these moving averages is considered to be daily. There are 4 component t are plotted on the chart:
- MACD Line: This line shows the difference between the 12-period and 26-period moving averages.
- Signal Line: The signal line is a 9-period exponential moving average of the MACD line.
- Histogram: The histogram shows the difference between the MACD line and the signal line in the form of bars. Using this, the traders can visualize the momentum of the stock.
- Zero Line: The zero line is an imaginary line on the histogram that shows the point where the momentum is zero.
These 4 are used together in combination to get insights into price trends and potential reversals.
Also Read: Top Stock Market Indicators Every Investor Should Follow
The Importance of the MACD in the Share Market

The MACD indicator is a crucial technical analysis tool for traders. It indicates the strength or reversal of a trend and simplifies the complex price movements to make life easier for traders. Here’s why moving average divergence convergence is important:
- Identify Trends: MACD can help you identify the ongoing trend in the market, whether it’s an uptrend or a downtrend.
- Momentum Insights: It shows the strength of a price trend and its momentum.
- Buy and Sell Signals: The MACD line and the signal line are in constant tussle. Depending on which line crosses above or below the other helps traders identify buy or sell signals.
- Flexibility: The MACD indicator is flexible and can be applied in different markets. Along with equity markets, it can also be used in forex and commodity trading.
How to Use the MACD Indicator?
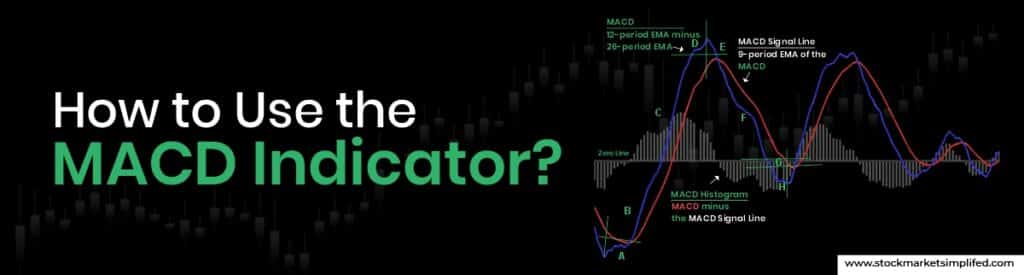
To use the MACD indicator effectively, you have to understand its signals and interpret them correctly. Here are some key strategies traders use:
Crossover Strategy
The easiest way to use the MACD indicator is to apply the crossover strategy. Let’s see how this works:
- Bullish Trend Reversal: When the MACD line crosses above the signal line, it indicates the potential for upward momentum.
- Bearish Trend Reversal: When the signal line crosses above the MACD line, it indicates the potential for a downward momentum.
Zero Line Crossover
Zero-line crossover can be used as a trend confirmation tool for the crossover strategy. Here’s how you can use the MACD line and zero line to build this crossover strategy:
- Bullish Trend: If the MACD line crosses the zero line from below, it suggests a bullish trend momentum.
- Bearish Trend: If the MACD line crosses the zero line from above, it suggests a bearish trend momentum.
Divergence Strategy
When the MACD line and the stock price show opposite movements, it indicates a divergence. Here’s how you can form your trading strategy using divergence:
- Bullish Divergence: If the stock price is falling but the MACD line starts making higher lows, it shows a potential upward trend reversal.
- Bearish Divergence: If the stock price is rising but the MACD line starts making lower highs, it shows a potential downward trend reversal.
MACD Calculation and Formula
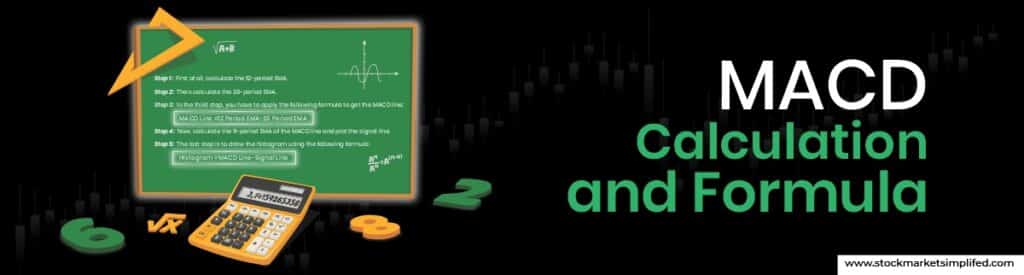
You can use this 5-step approach to calculate the MACD indicator:
- Step 1: First of all, calculate the 12-period EMA.
- Step 2: Then calculate the 26-period EMA.
- Step 3: In the third step, you have to apply the following formula to get the MACD line:
MACD Line =12 Period EMA-26 Period EMA
- Step 4: Now, calculate the 9-period EMA of the MACD line and plot the signal line.
- Step 5: The last step is to draw the histogram using the following formula:
Histogram =MACD Line-Signal Line
Practical Examples of MACD in Action
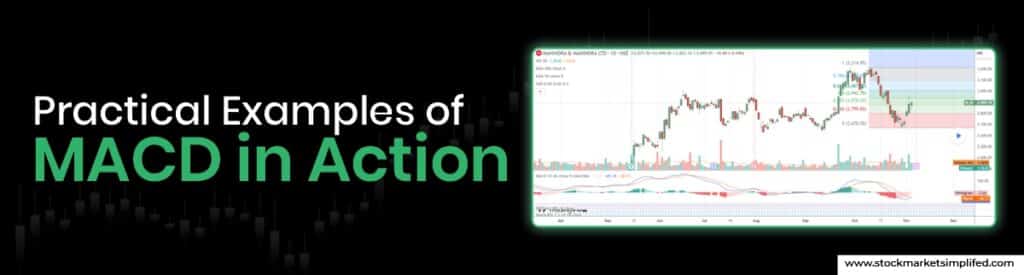
The Moving Average Convergence Divergence (MACD) indicator helps traders catch changes in trend points in a stock. In its latest performance, Meta Platforms (META) smashed through Q3 earnings estimates to retake buy points in short order as shares rocketed away from their 50-day moving average and broke their short-term downtrends.
What is also important to note is the strong reversal from lows that Mahindra & Mahindra saw, which is well above major Fibonacci retracement levels. Besides, the MACD had shown a bullish cross set to form a bullish cross in the coming time frame.
This is where the MACD can be used to track momentum shifts and capitalize on the revolving market movements.
Limitations of the MACD Indicator
The moving average divergence convergence is an effective tool for technical analysis. But, it is not without its limitations. Here are the things you should be wary about while using this indicator:
- Lagging indicator: The MACD indicator follows the trend. This means that it lags behind the price movements and provides indications of a delay.
- False Signals: When the market is moving sideways, or there is low volatility, the signals generated by MACD may turn out to be false.
- Insufficient: The MACD indicator is not sufficient to be used alone. You need to club it with other indicators to confirm the pattern so that there are no errors.
Also Read: Best Indicators for Options Trading in India
How to Get Started with the MACD Indicator?

Now that you know how the MACD indicator functions, it is time to tell you about its application. First of all, you do not have to perform the elaborate calculations. Follow these steps to set up the MACD indicator and start using it in your technical analysis:
- Step 1: Choose the appropriate trading platform
- Step 2: Setup the MACD indicator with the default settings of (12,26,9). However, you can change these parameters to adjust it according to your strategy and timeline.
- Step 3: Use a combination of tools like support and resistance, RSI, Bollinger bands, etc, along with the MACD indicator to get the best results.
- Step 4: There is no alternative to practice. Test your strategy on historical charts of stock prices and gain confidence.
Conclusion
If you want to use the complex data of price movements and simplify it, the MACD indicator is one of the best tools for you. As a trader, you can use the MACD to identify the ongoing trends, their strengths, potential reversals, and the momentum of the stock price. While there are limitations to the MACD indicator, you can combine it with other technical analysis tools to make the best trading strategy.
FAQs
How to read the MACD indicator?
If you want to analyze the MACD indicator and use its data for profitable trades, you can study the following markers:
Crossovers
Histograms
Zero-Line crossovers
Trends and momentums
Is MACD a leading indicator?
The MACD indicator follows the price trends and provides indications of a trend that’s ongoing. Hence, it is a lagging indicator. You can use it to confirm the existing trends in the stock’s price.
How to avoid MACD false signals?
In a less volatile market, the MACD indicator can give false signals. Hence, it is the best idea to use it in combination with other tools like RSI, Bollinger bands, Fibonacci retracement, etc.
How to use the MACD indicator for intraday trading?
If you want to use the moving average divergence convergence for intraday, you should take shorter timeframes like minutes or hours. You can look for crossovers and divergence patterns to devise an intraday strategy.
What is the best moving average convergence divergence setting?
The default settings of the MACD indicator, i.e., 12, 26, and 9 periods, are ideal for short-term traders. But, if your trading horizon is different, you can adjust the settings according to your preference.