Option Greeks Explained: What They Are and Why They Matter

Options market is the new word, not only in the stock world but even in the crypto world. For beginners, option trading can be exciting, but it’s also tricky. The more lucrative it seems, it comes with certain setbacks, especially for those who are unaware of the philosophy of option greeks.
These greeks are secret numbers that tell you how much an option might change in price based on different things like time, the stock price, and how much the stock moves up or down. But it is not as easy as a simple philosophy, you need to delve into the technical knowledge to apply it in your trading set-up.
With this blog, we will learn what are option greeks, its types, and how to calculate them for informed options trading. So let’s begin.
What Are Option Greeks

Option Greeks are key metrics used in options trading to measure how different factors affect the price of options. In technical terms, these Greeks are financial measure tools that help investors decode how an option’s price might change based on different factors. These measures show how the option’s price reacts to changes in things like the stock price, time, and market volatility.
The most commonly used Greeks are:
- Gamma
- Delta
- Theta
- Rho
- Vega
Option Greeks don’t claim to show exact changes in an option’s price. Rather than that, they give a rough idea on how an option’s value might change when factors like the stock price, interest rates, dividends, time, or market volatility shift. They act like a valuable guide for investors to predict potential price movements.
Also Read: Understanding the Benefits of Holding Stocks for the Long Term
Elements Used to Calculate Option Greeks
Most pricing models use the following inputs to determine theoretical values and the corresponding Greeks:
Stock price: The current price.
Strike price: The set price at which the stock price is expected reach
Time to expiration: The option’s expiration date.
Implied volatility: Talks about number of active traders.
Interest rate: The latest risk-free interest rate.
Anticipated ordinary dividends: Assumed dividends that the stock will pay before the option expires.
Delta

Delta is a key concept in options trading. The main motive of delta is to tell investors how much an option price would change in respect to every ₹1 move.
If simply put, it predicts the change in option price for every ₹1 move to stock price.
- Call Options: Delta ranges from 0 to 1.
- Put Options: Delta ranges from 0 to -1.
Let’s understand this using an example. Suppose if a call option has a Delta of 0.5, and the stock moves ₹1 up, that means, the price of option will also most likely go up by ₹0.50.
Delta in Call and Put Options
Here a list of points to be known before you review Delta for both call and put options:
Call Options:
- Positive Delta: Call options have a Delta between 0 and 1.
- At-the-Money (ATM): In ATM, it moves around 0.50.
- In-the-Money (ITM): It goes close to 1 in ITM.
- Out-of-the-Money (OTM): Close to an expiry, it becomes 0 or close to 0.
Put Options:
- Negative Delta: Put options have a Delta between 0 and -1.
- At-the-Money (ATM): In this, Delta is typically around -0.50.
- In-the-Money (ITM): At ITM, Delta moves closer to -1.
- Out-of-the-Money (OTM): Near expiry date, Delta gets closer to 0.
Gamma

Gamma is like the next step after Delta. While Delta measures how an option’s price changes with the stock price, Gamma measures how much Delta itself changes when the stock price moves by ₹1.
Imagine it this way: if Delta is the speed of price change, Gamma is its acceleration.
For example:
Imagine an option with a Delta of 0.40.
Now if the price of the stock increases by ₹1, Delta may also go up by 0.55.
The difference (0.15) is the Gamma—it shows how much Delta changed.
Gamma is generally viewed as the highest when the option is at-the-money or ATM. As soon as the price of an option goes deeper ITM or close to OTM, Gamma gets smaller.
Now why does this happen?
Because Delta comes closer to its limit (1.00 for in-the-money options), thus leaving almost less room for it to accelerate.
In simple terms, Gamma shows how “fast” Delta is changing!
Theta

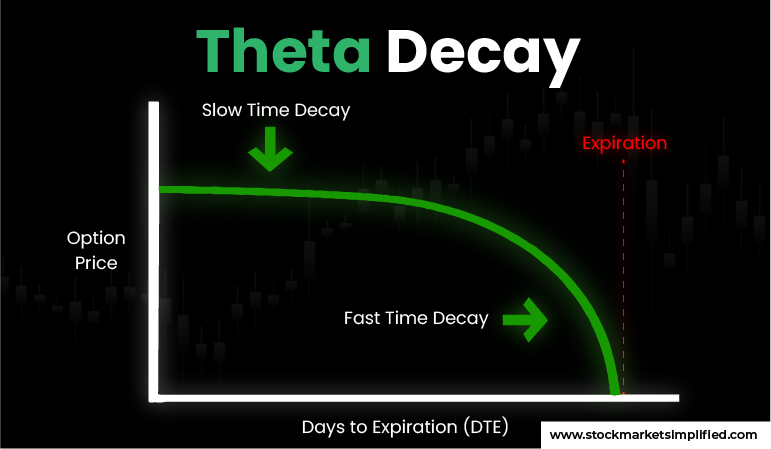
A figure of theta calculates how much the price of an option drops as time goes by. It is often called the “time decay” of an option because the value of time drops over time. Essentially, Theta shows how much value an option loses each day as it gets closer to its expiration date.
Time-value erosion isn’t linear. See it this way, if the price of an option whether ATM (At-the-money), or slightly out-of-the-money (OOTM), and in-the-money (ITM) go close to expiry, the speed of value decay increases. Now, for options which are far out-of-the-money (OOTM), the time decay generally slows down as expiration approaches.
Theta is always negative for both call and put options. It basically shows as time passes by, the value of the option generally goes down. For example, if an option has a Theta of -₹0.05, this means the price of an option will drop everyday approx ₹0.05.

Why Theta Matters
Theta is a super important element to take in picture, especially for option traders because it tells them how much an option’s value decreases as time passes. It helps you decide when to buy or sell options.
- For Option Sellers: Theta decay works in your favor. As time passes by, the option you sell loses its value, offering more room to you to either buy it back cheaper or let it expire worthless.
- For Option Buyers: Theta is a challenge. Every day, your option loses value just because time is ticking. This means the stock price needs to move enough in your favor to cover that loss.
In short, Theta reminds you that time is money—literally—when trading options!
Vega

Vega is about how much price of an option changes when the volatility of the underlying asset goes up or down by 1%.
If you see Higher Volatility = It means Higher Option Price: When volatility rises, price of an option increases. Vega tells you exactly how much.
For Example: If an option’s Vega is 0.10, a 1% hike in volatility will take its price by ₹0.10. Similar to this, a 1% drop will decrease its price by ₹0.10.
Vega is especially important for options with more time left to expire or ones at-the-money. Even though it’s not an official Greek letter, Vega is crucial for understanding how price reacts to market swings.
Rho

Rho shows how an option’s price reacts when interest rates change by 1%.
Now, let’s first take a look how it works:
- Positive Rho: Usually call options have this. In this, their price goes up if interest rates rise.
- Negative Rho: This is common for put options. Their price drops when interest rates increase.
Let’s check it with a quick Example:
Imagine a call option with a Rho of 0.05. If the interest rate changes from 6% to 7%, option’s price may also go up with the rate of ₹0.05 per unit.
Now, if you’ve got 10 of these options, your total gain would be ₹0.50 (₹0.05 × 10).
While Rho isn’t seen by investors as the biggest factor in pricing, It is still considered really handy to know about, especially when investors feel that interest rates might change, like before a major central bank announcement.
Implied Volatility: Like a Greek

Implied volatility (IV) isn’t also a Greek letter, but traders would feel it otherwise. IV shows how much the market expects a stock to move in the future. On the contrary of historical volatility that basically looks at past price changes, IV tells about future fluctuations based on events like earnings, mergers, or new product launches.
Also Read: How to Spot Undervalued Stocks: A Value Investor’s Guide
Why Implied Volatility Matters:
IV can help traders make smarter decisions, whether they’re buying or selling options, but the most important question is why?
Here are a list of reason why option traders considers this really wise choice to know about market IV:
Market Forecast: It reflects the market’s expectation of how much a stock might move, considering upcoming events.
Trading Strategies: High IV is good for option sellers (they earn from premium decay), while low IV favours option buyers (cheaper entry costs).
Decision Support: Most trading platforms show IV, giving you an edge over pure guesswork.
Variation in Options: Options near the stock’s current price usually have lower IV than those far out-of-the-money or deep in-the-money.
Analysis Tools: Comparing current IV with past price movements can help identify if options are over- or under-priced.
In Essence
Understanding the Option Greeks is like having a secret weapon in the world of options trading. These mathematical formulas offer invaluable insights into option prices and help you make informed decisions. While the concept might seem complex at first, breaking down each Greek individually can simplify the process. By mastering the Option Greeks, you’ll be better equipped to make your way through the dynamic options market and increase your chances of success. Remember, options trading involves risks, and it’s essential to do your own research or use technical analysis methods such as demand-supply dynamics to make a foolproof trading setup.
FAQs
What is an option?
A financial contract giving the holder the right, but not the obligation, to buy or sell an underlying asset at a specified price (strike price) within a specific timeframe.
What is the difference between a call and a put option?
A call option gives the holder the right to buy, while a put option gives the holder the right to sell.
What is the difference between a call and a put option?
A call option gives the holder the right to buy, while a put option gives the holder the right to sell.
What are options trading strategies?
There are several options trading strategies such as bull call spread, bear put spread, straddle, strangle, covered calls, protective puts that an investor can use to strengthen their trading set-up.
What is option chain analysis?
Option chain analysis is a method for studying the stock market by examining the data in option chains. This data can reflect market sentiment and expectations about the future price movement of the stock.

 Instagram


