
 Instagram


The biggest challenge you can face as a trader is to identify the exact point from where the stock price will start moving in a different direction or reversing. There are many technical analysis tools that help traders understand the complex price movements and make informed decisions.
One of the most reliable reversal patterns is the head and shoulders pattern. If you find this formation on the charts of a stock, you can be certain that a reversal is around the corner.
In this blog, we will discuss what is the head and shoulders pattern in detail. We will look at its working and what happens when you find the head and shoulders pattern inverse. You will also learn to strategize your trades according to this pattern and make the most of it.
What Is the Head and Shoulders Pattern?

Let’s start our discussion by understanding what the head and shoulders pattern is. To put it simply, the head and shoulders pattern shows a potential reversal in the ongoing trend of the stock price.
- Inherently, the head and shoulders pattern is a bearish reversal pattern.
- It shows the point from where the ongoing bullish trend ends and the stock price starts to fall.
- However, an inverse head and shoulders pattern show a potential bullish reversal.
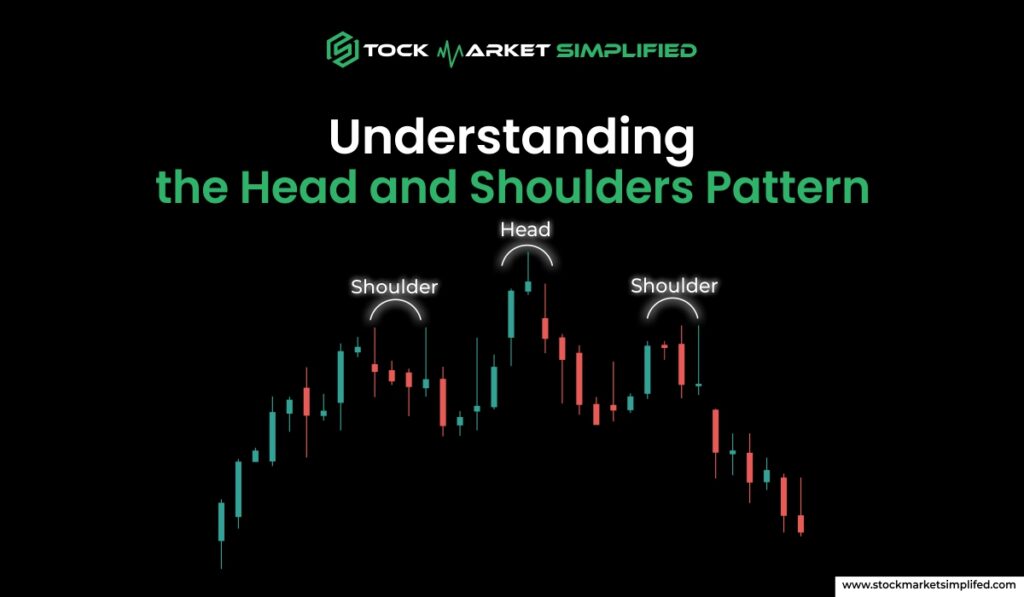
Now you would ask, what are the characteristics of the head and shoulders pattern, and how can you identify it? The pattern consists of 3 peaks consisting of 1 head and 2 shoulders. Here’s how you can identify it:
- Left Shoulder: The first formation is known as the left shoulder. In this, the price forms a peak and then declines.
- Head: The second formation is known as the head. It forms the highest peak.
- Right Shoulder: The third formation is again a shoulder forming a smaller peak than the head. It is called the right shoulder and shows the slowing down of momentum.
- Neckline: The line passing through the troughs of the 3 formations is called the neckline. Traders usually follow this as the entry point to the trades.
If you want to interpret the head and shoulders pattern meaning, it shows that the existing trend, whether bullish or bearish, has lost its steam and there is a potential reversal on the cards.
Also Read: Bearish Candlestick Pattern
Types of Head and Shoulders Patterns
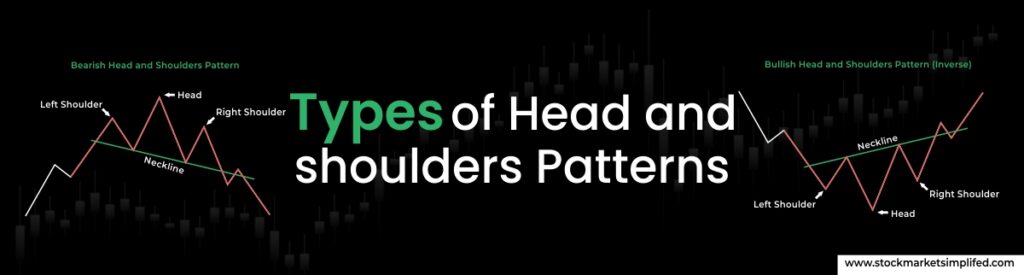
Now that you understand the formation of the head and shoulders pattern, it is time to learn about the types of this pattern. There are 2 types of head and shoulder patterns. Let’s look at them:
Bearish Head and Shoulders Pattern
The head and shoulders pattern inherently is a bearish pattern. This means that it shows the reversal of an ongoing bullish trend in a stock’s price. If this pattern is formed on the stock charts, it indicates the beginning of a downtrend. The characteristics of the bearish pattern are:
- The formation consists of 3 peaks.
- The 2 shoulders and one head show peaks and corrections.
- The middle formation or the head, forms the highest peak.
Bullish Head and Shoulders Pattern (Inverse)
Have you thought about what would happen if the head and shoulders pattern inverse were formed on the stock chart? Well, it will become a bullish formation, showing the reversal of an ongoing bearish trend. Unlike the bearish pattern that has 3 peaks, the bullish head and shoulders pattern is formed with 3 troughs. Here’s how this pattern looks:
- Left Shoulder: It shows the formation of a low point or a trough followed by a temporary rise in the stock prices.
- Head: The head is the middle formation, which shows the lowest point or the lowest trough of the 3.
- Right Shoulder: The head is followed by a right shoulder that makes a higher low showing a reduced pressure of selling.
Key Rules for Identifying the Pattern

There are some head and shoulders pattern rules you should follow to be sure about the formation of the pattern and avoid false signals. Here’s what you should look for in the head and shoulders pattern:
- Symmetry: The shoulders form a lower peak as compared to the head. While they should not be exactly identical, there must be symmetry between them. They should form similar peaks and bottoms to indicate the pattern formation.
- Neckline: If you draw a trendline joining the lows in the bearish pattern and highs in the bullish pattern, it will show the neckline of the head and shoulders pattern. Ideally, this line will be close to perfectly horizontal.
- Volume Confirmation: The biggest giveaway to identify the pattern is the volume. While the pattern is formed, the volume remains low. But, the breakout happens with a sudden spike in the volumes.
- Breakout: The final stage of the head and shoulders pattern is the breakout. This happens when the stock price breaks the neckline with increased momentum and high volume.
How to Trade the Head and Shoulders Pattern?
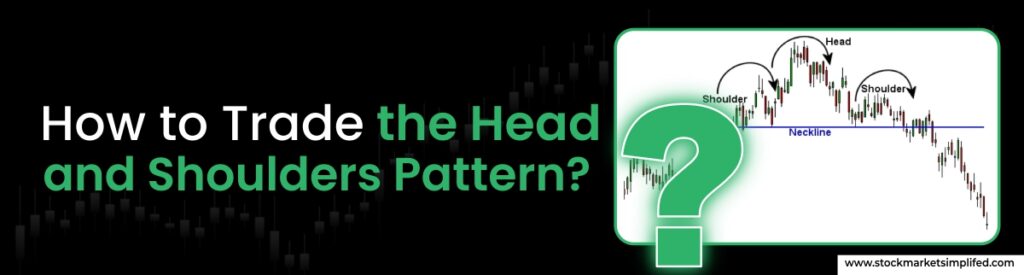
Having learned about the head and shoulders pattern, its formation, and confirmation, it is time to understand how you can strategize your trades to make the most of it. To be able to trade the pattern, you should know what are the ideal entry and exit points. Let’s see how you should trade:
- Entry point: You should enter the trade once the stock price breaks out:
- below the bearish neckline or
- above the bullish neckline.
- Target/Exit Point: The distance between the head and the neckline is the potential downside or upside in the stock price post the breakout. You can project this distance vertically from the breakout point to get your target.
- Stop Loss: It is ideal to trade using stop losses to avoid capital erosion. You should put a stop loss:
- below the right shoulder in the bullish pattern and
- above the right shoulder in the bearish pattern.
Advantages and Disadvantages of Head and Shoulders Pattern

There are both advantages and disadvantages to using the head and shoulders pattern. Let’s look at both of them in detail:
Advantages
Here are the main advantages of using the head and shoulders:
- It is a highly reliable pattern.
- Traders can depend on this pattern to identify reversal patterns.
- It provides clear points for entry and exit.
- The pattern is not confusing and easily identifiable for even a layman.
- It is applicable to different markets and timeframes.
Disadvantages
Of course, there are disadvantages to using the head and shoulders pattern. Here are the main drawbacks:
- When the markets are highly volatile, and there is less certainty, the head and shoulders pattern can show false breakouts.
- To identify the pattern accurately, you need experience in stock analysis.
Also Read: How to Analyze a Stock: Key Metrics You Must Know
Common Misconceptions and Challenges
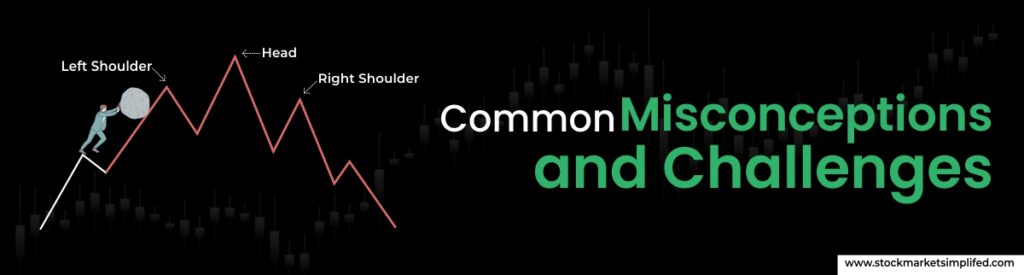
Here are some points that can help you avoid going down the slippery slope with the head and shoulders pattern. Avoid these mistakes to utilize this pattern to the fullest:
- Wrong identification: The stock prices make random peaks and troughs. If you become overenthusiastic and misinterpret, it can cost you dearly.
- Ignoring Volume: The drop in volume during the head and shoulders pattern formation and the sudden spike with the breakout are typical identifiers of the pattern. If you don’t confirm the pattern, it can damage your savings.
- Using the pattern alone: It is a good practice to combine different technical analysis tools. It can help you confirm the pattern and reduce the risk of false signals.
In the end…..
If you are a trader who wants to identify reversal patterns in stock prices, look no further. The head and shoulders pattern is a highly accurate tool to help you make profitable trades when the stock prices reverse. Depending on the ongoing pattern, the head and shoulders can be both bearish and bullish. Lookout for the head and shoulders inverse to identify the bullish formation.
FAQs
What happens after the head and shoulders pattern?
The outcome of the head and shoulders pattern is simple. The price of the stock usually moves in the direction of the breakout, whether bearish or bullish.
Is the head and shoulders pattern bullish or bearish?
Typically, the head and shoulders pattern is a bearish formation, which shows the reversal of an ongoing bullish trend. However, the head and shoulders pattern inverse indicates a bullish formation with 3 consecutive troughs.
How to draw the head and shoulders pattern?
There are 3 main components of the head and shoulders pattern:
2 shoulders: They are symmetrical and form lower peaks or higher troughs compared to the head.
Head: The middle formation with the highest peak or the lowest trough is the head.
Neckline: The trendline joining the lowest points in the bearish pattern or the highest points in a bullish pattern is the neckline.
What is the best time frame for head and shoulders?
You can use the head and shoulders pattern on multiple timeframes. However, it is a reliable indicator in the short term.