Bearish Candlestick Pattern
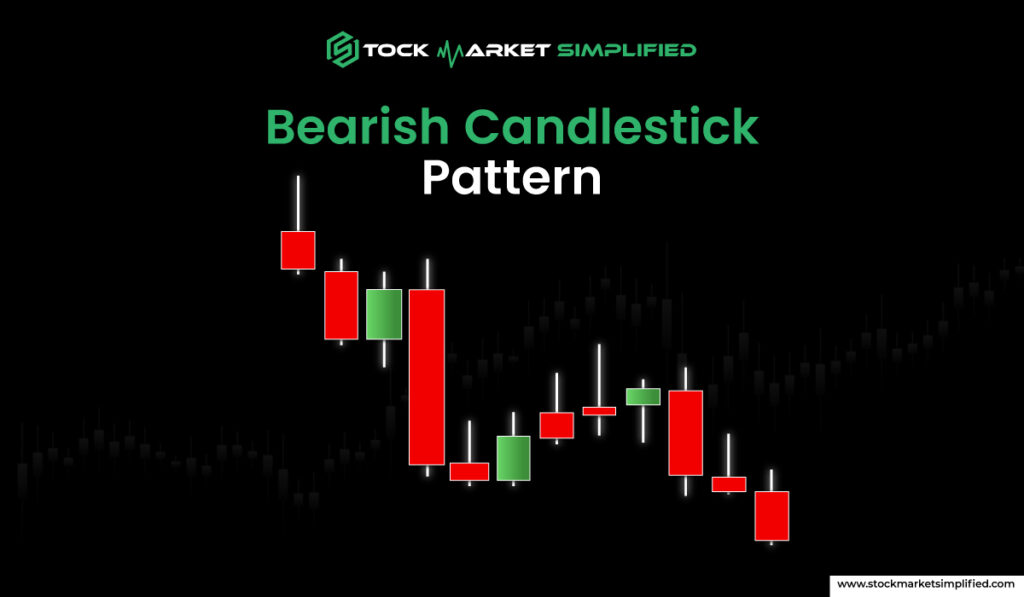
In the world of trading, the market plays the game in two distinct faces – either bullish or bearish. Skilled traders believe that it’s impossible to maintain a bullish outlook in bearish time – seems counterintuitive at first glance.
Regardless of the fact, a wise trader can remain bullish in both bearish and bullish phases. Unbelievable, right?
According to experts, with the right strategies you can make more money in bearish times than vice versa. The question is how?
By early detecting the dominating sellers using a robust trading strategy along with risk management. Conventional technical analysis techniques suggest several bullish and bearish candlestick patterns that whisper the answer of most asked questions in stock industry ’where’s the market headed next?’
With this e-paper, we aim to study all the bearish candlestick patterns that boast of a bear hit.
Let’s begin without wasting any time.
What is Bearish Candlestick Pattern

Bearish candlestick patterns are the graphical candlestick formations on the price chart that show a potential downtrend in a stock or security. Unlike bullish candlestick patterns, bearish formations show the potential decline in the price and give an early indicator on the potential win of sellers. By spotting these moves, one can plan their trades, exit from the market, or open their sell orders for maximum benefits.
Here are listed some commonly known bearish candlestick patterns that help you early detect the whole drop, keeping you one step ahead:
Also Read: Diwali Muhurat Trading: A Blend of Tradition and Prosperity
Engulfing Pattern
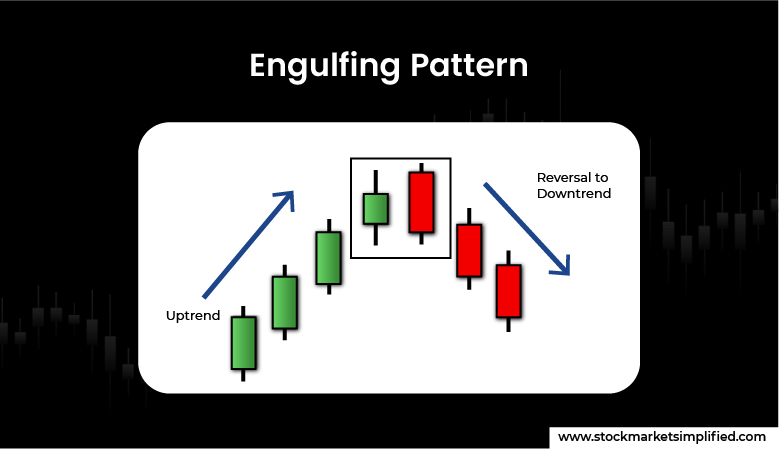
A bearish engulfing pattern appears when a large bearish (red) candle fully engulfs the previous green candle. This is a signal for a potential reversal into a downtrend. Whenever a bearish engulfing pattern is spotted, the formation indicates a potential downward movement in a stock or security. The pattern is considered one of the most powerful reversal formations, showing a red flag and more active seller alert. Often it’s found at the end of an uptrend.
How to Spot A Bearish Engulfing
- The formation includes two candles – the first candle (green) is relatively smaller than the second one (red candle).
- The first candle (green) contains a smaller body and wick.
- The second candle (red candle) is often larger in size and engulfs (covers) the body of the previous candle.
- Most importantly, the high of the second candle should be higher than the prior one.
Dark Cloud Cover
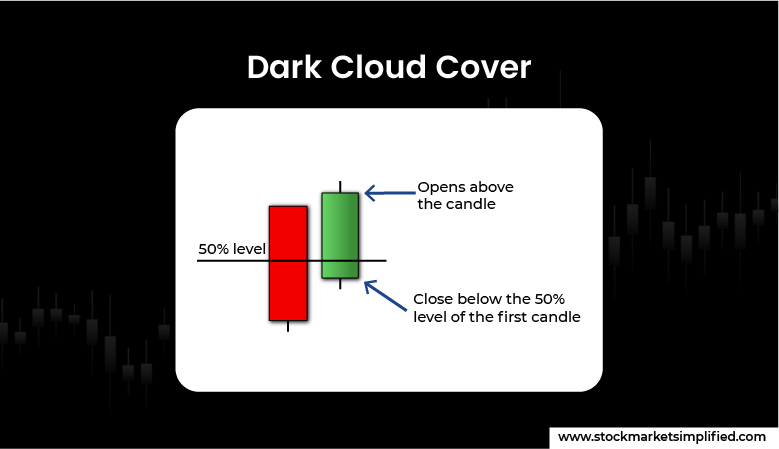
Dark Cloud Cover is one of the bearish reversal candlestick patterns. Opposite to the piercing pattern, it is formed at the end of an uptrend. This consists of two major candlesticks – the first one is an exciting green candle, followed by the second (red) candle, creating an illusion of a ‘dark cloud’ over the previous candle.
When a dark cloud cover appears on the chart, it signals a red alert to traders, warning about the potential reversal in the market direction. Often traders find this pattern useful for spotting potential price reversal, however, in the choppy price action, this pattern proves less significant as the price remains in the same pattern.
How to Spot A Dark Cloud Cover
- The first candle is often bullish (green color) in an uptrend.
- Followed by a gap up candle, the next candle is often bearish (red candle).
- The close of the second candle is below the midpoint of the previous candle (covering at least 50%)
- Both candles contain large bodies with very short or no shadows.
Tweezer Top
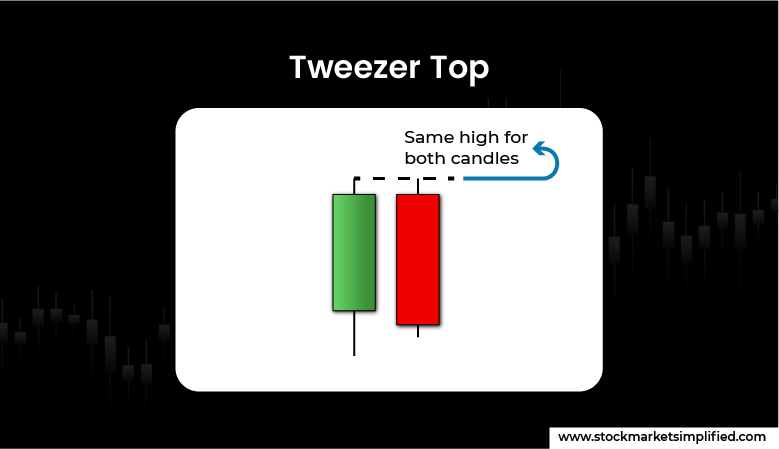
A Tweezer Top is one of the powerful bearish reversal patterns in the stock world. What it needs – an uptrend, a green candle (bullish) and a follow-up red candle on the next day (bearish) with a similar high. The first, green candle tries to announce the pressure of bulls, taking the price upwards. However, the second (red) candle drives the price down, showing a great hit of bears in the uptrend. If the first (green) candle has a larger body than the second one (red candle), the reversal is more reliable.
How to Spot A Tweezer Top
- In an uptrend, the first candle is in green colour.
- The second candle in the opposite, red colour.
- The high of the second candle is similar to the previous day.
- Often the trend reversal can be observed on the third day.
- If the Tweezer Top appears during the uptrend or highs of the market, it’s viewed as more reliable.
Evening Star
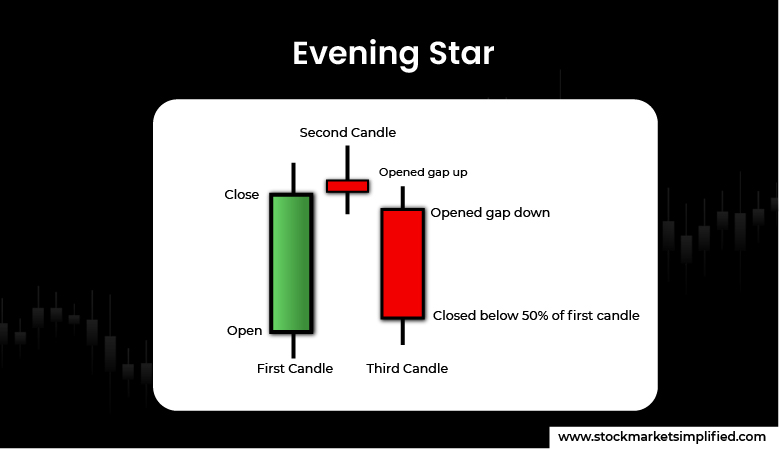
It is one of the most popular and closely observed patterns that depicts the bearish trend reversal in the price. An evening star is used for technical analysis to understand the direction shift at the end of an uptrend. Both evening and morning stars are considered as complex patterns due to their formation based on three successive candles. These patterns appear rarely on the charts, comparative to other single-candle formations.
How to Spot An Evening Star
- The first candle formation is green, near the end of an uptrend.
- The middle candle is a base candle, often formed near the end of the top of the first candle.
- The third candle is red, showing the reversal in price and triumph of sellers.
- Mostly, there is a gap in the second candle relative to both the first and third candle.
Shooting Star
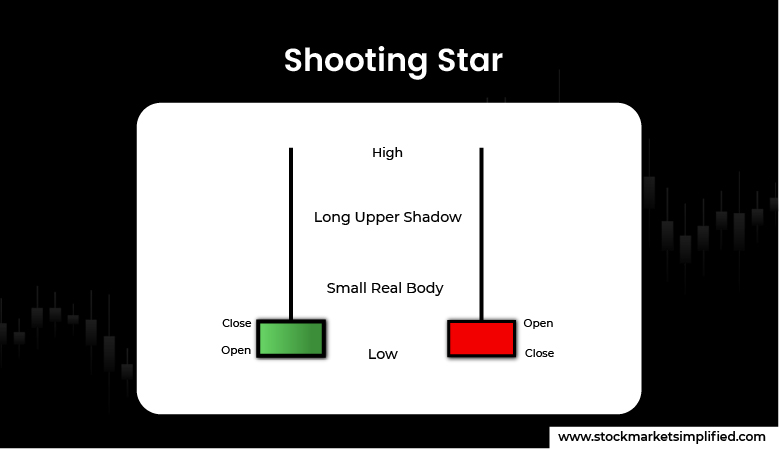
Just the shooting star in the sky, this one is instead created in a chart, making your wish come true. This formation is often found at the top of an uptrend, beaming of a price reversal. It is a bearish reversal candlestick pattern that shows the end of the buying era for a while. The formation is created using one candle where the low, close, and open are roughly hanging on the same price. The wick or shadow is longer, over twice the size of the body part. As shown in the picture, the candle looks like an inverted hammer candle.
How to Spot A Shooting Star
- The candle appears at the top of an uptrend.
- The wick is twice or three times longer than the body.
- The open, close, and low are nearly the same level.
- The lower wick of the shooting star creates barely to nothing, showing a confidence of sellers’ domination.
Hanging Man
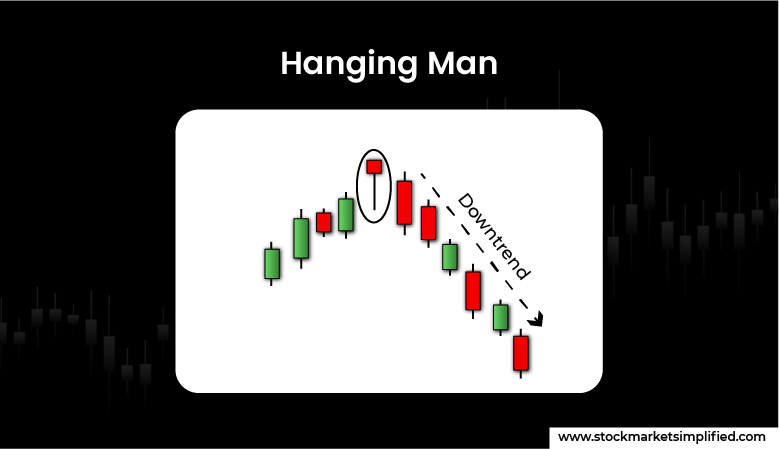
Yes, the hanging man but with no crime or death. The formation is considered a bearish reversal pattern, telling trader’s it’s time to spill red all over the chart for a while. It is one of the most popular and reliable tools among traders to forecast the trend direction. The pattern belongs to one-candle formation that includes open, high, or close of almost similar price. You might not be able to spot an immediate reversal after the formation of hanging man, but it’s an indicator for upcoming swift in trend’s direction.
How to Spot A Hanging Man
- The formation includes only one candle (base candle).
- The candle is easy to spot as it has a very long lower wick.
- The upper wick’s length remains between little to no wick at all.
- It’s a technical indicator however it is not directly showing the reversal, hence waiting to confirm the reversal using another approach.
Bearish Harami
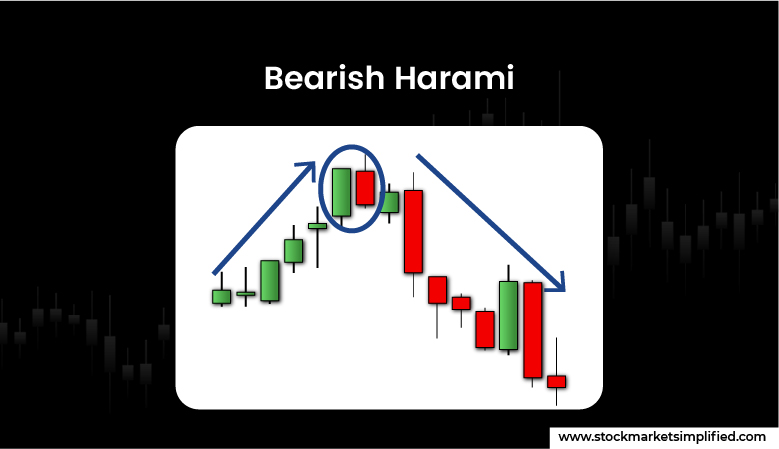
Bearish Harami is one of the most commonly used bearish reversal patterns that belongs to two candle formations. Used in technical analysis, traders often rely on bearish harami due to its lack of reliability and complement it with other technical indicators or theories such as demand-and-supply, moving averages, MACD indicators etc.
As funny as it sounds to some, the term ‘Harami’ owns the structure of the entire pattern with itself. “Harami” is a Japanese word which means ‘Pregnant’. Visually, the first (green) candle takes over the structure of the second (red) candle, giving an impression of Pregnant women as shown in the picture. The pattern tells the story of a neglect in buyers and an overpowering army of sellers, leading to a bearish phase in the stock market for a while.
How to Spot A Bearish Harami
- The first candle often is an exciting, green candle, showing a bullish face.
- The second candle is a base/small red candle, engulfed (covered) by the prior candle.
- Often the second candle opens down with a gap, an important aspect to observe.
- The body of the 2nd candle will be within the body of the 1st candle, indicating a reversal.
Three Black Crows
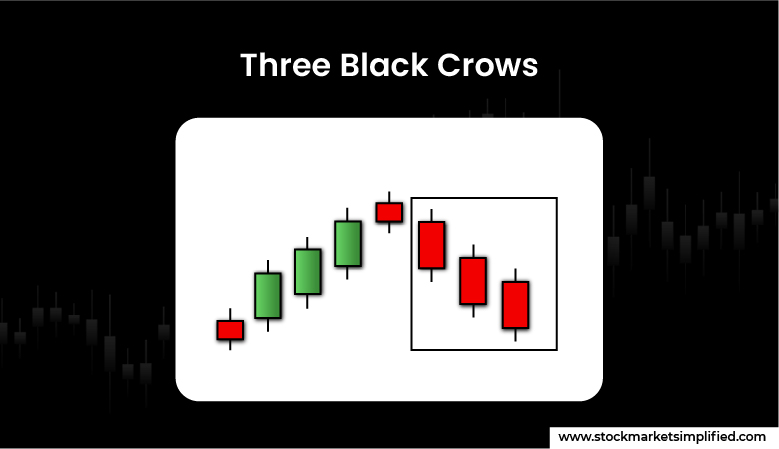
Three Black Crows is a bearish reversal candlestick pattern that shows change in the wave of market direction. The format belongs to three candle formations, hence it’s frequently observed and doesn’t function properly in the choppy market. It’s only considered valid if it appears in the strong uptrend. It shows that the buying pressure is getting weakened and it’s time for bears to take control. In this, the price fell for three consecutive days, whispering about the increasing number of sellers in the market. The opposite of three black crowns is Three White Soldiers that shows a bullish behavior.
How to Spot A Three Black Crows
- First candle is a long bodied, red candle, created in the continuation of the ongoing uptrend.
- The second candlestick should be red, either long bodies or short bodies.
- The opening of the second candle should be above the closing of the first bearish candle.
- The third candlestick should also be a bearish red candle with either a long or short body.
- The opening price should be able to look eye-to-eye to the closing or above to the closing of the second candle.
- The third candle should be less than the high of the second candlestick.
- It can also be Bearish Marubozu, a candle with a long body and no to little wick.
In Essence
These bearish patterns are used by traders to identify potential entry and exit points in the market and are often used in conjunction with other technical indicators for confirmation. Relying on the market based on your intuition and basic understanding of the market is not enough. In order to do better among the crowd of amateur traders, what you need is a handful of knowledge about price charts, technical analysis, and the ability to draw conclusions on your own. Bearish candlestick patterns are useful for forecasting when the price of an asset is about to go up or down. These are not foolproof approaches to look at the market but help come up with a pattern that might tell you what’s next. Traders can stay one step ahead of conventional analysis methods via combining it with more profound concepts such as demand-supply dynamics for informed decision making.
FAQs
What are bearish candlestick chart patterns?
Bearish candlestick chart patterns are formations or visual graphics on charts that contain price action. What for? To identify a potential continuation or reversal into a downtrend. Often traders get more alert and interpret a bear market after the appearance of bearish candlestick chart patterns.
What are some common bearish candlestick patterns?
There are several bearish candlestick patterns that can help traders early detect market mood, however, they are not completely reliable and require additional theories such as demand-and-supply, moving averages, etc. Some of those bearish candlestick patterns include the evening star, the hanging man, three black crows, etc.
How are bearish candlestick patterns interpreted?
Bearish candlestick patterns are decoded based on the shape and position of the candlesticks on a chart. They are often seen as signals that the market sentiment is turning bearish and that prices may decline.
Do bearish candlestick patterns always indicate a downtrend?
While bearish candlestick formations are designed to show a potential downtrend, the precision in terms of accuracy is not always on the point. It is very crucial for traders to not go by the only conventional methods and use them with other forms of analysis such as demand-and-supply to increase accuracy of research.
How can traders use bearish candlestick patterns in their trading strategy?
Well, if you know the trend is gonna take a reverse turn, then it’s a jackpot (only if you know how to use the info for profit). Traders can use bearish candlestick patterns to spot potential entry and exit points for trades. For instance, traders might use a bearish engulfing pattern as a sign of stock selling and bearish harami to enter a short position.
Do bearish candlestick patterns work in all markets?
Probably! The pattern can be effective in several markets such as forex, commodities, stocks, and cryptocurrencies. However, the effectiveness of specific bearish candlestick patterns may vary depending on the market situation and other liable factors. Always pair conventional chart methods with other theories or technical indicators to make your research foolproof.

 Instagram


