Top Stock Market Indicators Every Investor Should Follow

Every investor dreams of tasting success like Warren Buffet and Rakesh Jhunjhunwala. But what makes them stand out? Their understanding of the markets, trends, and investor sentiments. But how can average investors take their game to the next level? Is there a way to predict the stock markets correctly?
Yes. Stock market indicators. These tools help you gauge the trends and make informed decisions. Whether you are a beginner or an experienced investor, learning about these indicators is crucial for success.
In this blog, we discuss leading stock market indicators and how they can change the way you approach your investments.
Essentials of Stock Market Indicators

To put it simply, stock market indicators are statistical tools that can be used to assess market conditions. What is the use of the stock market technical indicators for investors? Here’s what you can do with them:
- Identify Market Trends: Understand which way the markets are moving and act accordingly.
- Evaluate Market Sentiments: Sense the market sentiment and see whether the investors are optimistic or pessimistic.
- Gauge the Strengths of Movements: See whether the trends are strong or weak. Observing the strength of each move can help you remain one step ahead.
- Identify Potential Reversals: Trend reversals provide the biggest opportunities for investors. Identifying a reversal early can help you make valuable trades.
- Make Informed Decisions: When it comes to the stock markets, information is money. Whoever can make informed decisions emerges the winner as a stock investor.
Based on what stock market indicators show, they can be divided into 4 major categories:
- Economic Indicators
- Technical Indicators
- Sentiment Indicators
- Volume-based Indicators
Let’s learn about each one of them in detail.
Also Read: Top 10 Mistakes New Investors Make in the Stock Market
Economic Indicators: The Backbone of Market Analysis

The economy is the foundation of the stock markets. Hence, a stable and healthy economy is good for investors. The economic stock market indicators reflect the health of the economy. Some of the key indicators are:
Gross Domestic Product (GDP) Growth
GDP shows the total economic output of a country over a financial year. The GDP growth rate is an indicator of how the economy is performing.
- A strong and steady GDP growth rate signals that the economy is strong and attracts more investments in the stock market.
- On the other hand, a shrinking GDP growth indicates economic troubles and downturns.
Fiscal Deficit
Government policies are reflected by the annual budget, and one of the key stock market indicators is the fiscal deficit.
- A higher fiscal deficit shows that the government is spending much more than what it’s earning. This can have a negative impact.
- A low fiscal deficit can show that economic growth is stalling and the government is not pumping more money for development.
- Highly fluctuating fiscal deficit rates show that the government has no control over the economy.
- A steady but favorable fiscal deficit is ideal for a developing economy and indicates positivity for investors.
Interest Rates
Central banks use interest rates to manage the market liquidity. Using it as a stock market indicator can help investors understand the economic trends.
- Low interest rates mean higher borrowings and more liquidity. More people prefer investments than making bank deposits leading to more cash in business. This is good for economic progress.
- Rising interest rates show that the economy is slowing down and shows negativity in the stock markets.
Inflation Rate
Inflation reduces the value of money and the purchasing power. High inflation dents profits and affects stock prices. Consumer Price Index (CPI) and Wholesale Price Index (WPI) are the leading stock market indicators for inflation.
Employment Data
Jobs are the means for the majority of the population to earn a living.
- Salaries add to the purchasing power of consumers, and a stable job market shows a healthy economy.
- A sluggish job market indicates economic struggles.
Using it as a stock market indicator, you can make the correct investment decisions.
Exchange Rate
One stock market indicator that is less talked about is the Exchange Rate. A country that imports major commodities like oil and gas is dependent on other countries.
- A favorable movement in the exchange rate means low import payments. It affects the economy positively.
- However, a falling exchange rate means you have to spend more for the same imports.
Mastering Technical Indicators for Trading Success

If you want to get your timing right as a trader, you should use the stock market technical indicators. The role of these indicators is to follow the price trends and volumes to predict future stock prices.
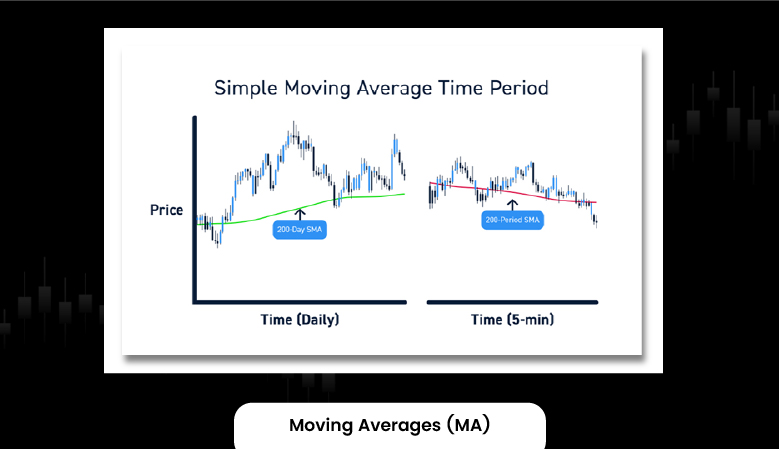
Moving Averages (MA)

Averages analyze stock prices at different points and provide a trend of price movements. You can use this stock market indicator to predict the range in which the stock prices will move. 2 types of moving averages are used in the stock market:
- Simple Moving Average (SMA)
- Exponential Moving Average (EMA)
Relative Strength Index (RSI)

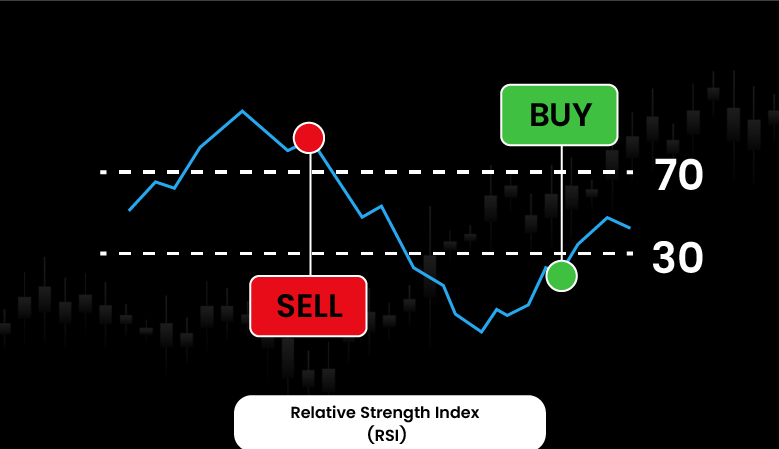
One of the leading stock market indicators is RSI. It measures the speed with which stock price is changing. The range of RSI is 0-100. However:
- If the RSI is above 70, the stock is overbought.
- If the RSI is below 30, the stock is oversold.
Bollinger Bands

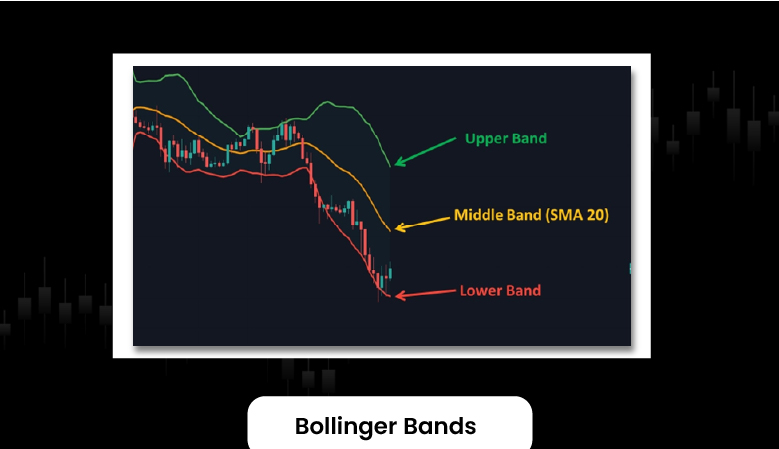
The structure of Bollinger Bands consists of 3 lines:
- The middle line is the SMA.
- Two outer bands show the price volatility.
- The lower line shows support, while the upper line shows resistance.
This is projected on the stock price graph and is a leading stock market indicator.
- If the price moves above the upper line, the stock is overbought.
- If the price moves below the lower line, the stock is oversold.
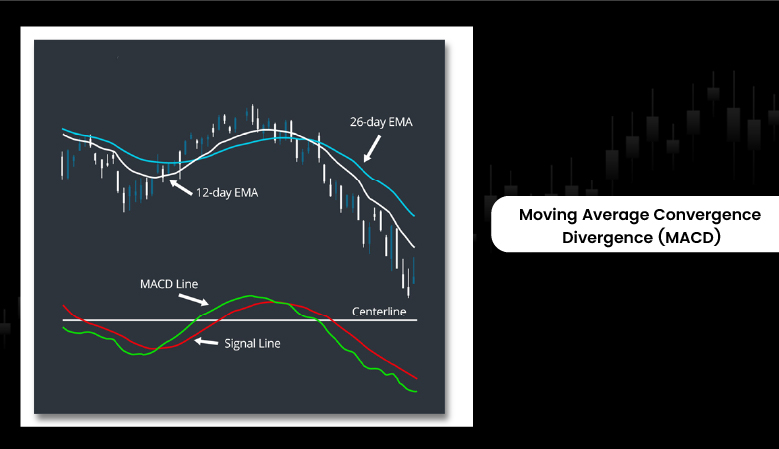
Moving Average Convergence Divergence (MACD)

MACD is calculated by subtracting the 26-day EMA from the 12-day EMA. A 9-day EMA (Signal Line) is calculated for the MACD line and plotted on top of it. This signal line shows the potential buy and sell triggers for a stock.
Sentiment Indicators: Understanding Market Psychology

Stock markets are driven by sentiments, i.e., the mood of investors. Is there a mechanism to gauge which way the markets can move? Sentiment stock market indicators are commonly used by investors to understand trends in the near future.
Volatility Index (VIX)
VIX shows the volatility in the stock markets. Investors can judge the rate of price fluctuations and the potential risk in trades. Usually, the VIX stock market indicator value stays between 15 – 25.
- VIX is around 15, it shows low volatility.
- VIX is around 25, it shows high volatility.
Put/Call Ratio
The ratio of the number of put options to the number of call options is called the Put/Call Ratio.
- If this ratio is high, it shows a bearish momentum.
- If this ratio is low, it shows a bullish momentum.
Volume Analysis: Why It Matters in Stock Trading

Market trends are effective when corroborated with considerable volumes. Here’s how you can use these stock market indicators:
On-Balance-Volume (OBV)
You can calculate OBV by following these steps:
- Take the volume on a current day.
- If the price increases on the next day, add the day’s volume to it.
- If the price decreases on the next day, subtract the day’s volume from it.
Strong volume support shows a persistent trend.
Volume Price Trend (VPT)
Instead of going into the complicated calculations, you can use the VPT line indicator and interpret it as follows:
- The rising VPT line shows a price increase with volume.
- A falling VPT line signals weak momentum.
Strategies for Effectively Using Market Indicators

- Instead of relying on a single indicator, use multiple stock market indicators.
- If different indicators show the same trend, it is stronger.
- Use stock market technical indicators to time your entry and exit correctly.
- Use economic indicators to identify trend shifts in advance.
Also Read: How to Spot Undervalued Stocks: A Value Investor’s Guide
Avoiding Pitfalls: Common Misinterpretations of Indicators

- Using only one indicator can lead you in the wrong direction.
- The indicators should be used with economic and geopolitical indicators.
- Short-term indicators can lure and fool you into making impulsive decisions.
In Conclusion
Stock market indicators help you peek into the short-term and long-term trends in the stock markets. Investors can use them to gauge market sentiments, predict future trends, and make informed decisions. Using multiple stock market indicators together can help you foolproof your decisions.

 Instagram


