

• contact@stockmarketsimplified.com
stockmarketsimplified stockmarketsimplified
  • Home
  • Glossary
  • Contact
Search the Site
Popular Searches:
iPhone Artificial Intelligence Smartphones
Recent Posts
Concentration Risk
What Is Concentration Risk? 
September 28, 2026
implied volatility
What Is Implied Volatility?
September 27, 2026
SME IPO Risks
9 SME IPO Risks to Know Before You Invest 
September 26, 2026
stockmarketsimplified stockmarketsimplified
  • Home
  • Glossary
  • Contact
Popular News
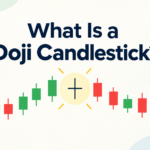
What Is a Doji Candlestick? A Doji candlestick appears like a plus sign or a cross on stock charts. If you've seen one, that's what it is. In simple terms, a Doji candlestick forms when the open and close prices of a stock are almost the same. It shows a tug-of-war between buyers and sellers, where neither side wins clearly. The Doji is a key candlestick pattern for beginners to learn. Doji Candlestick Meaning The word "Doji" comes from Japanese, and it roughly means "mistake" or "the same." That's fitting because a Doji candle shows a moment when the market couldn't decide which way to go. Think of it as a rope-pulling contest. Buyers pull one way, while sellers pull the other. By the end of the session, both sides are nearly back where they began. That's the core Doji pattern meaning for beginners. How a Doji Candle Forms (Open and Close Prices) Every candlestick has four price points: open, high, low, and close. In a normal candle, the open and close prices differ quite a bit, which gives the candle a thick body. In a Doji candlestick, the open and close prices are nearly equal. This forms a thin or nearly invisible body. Wicks, or shadows, extend above and below. Those wicks show how much the price moved during the session. Then, it returned close to the opening level. Main Types of Doji Patterns Not all Doji candles look the same. Here are the main types every trader should recognize: Standard/Neutral Doji: Small wicks on both sides, showing balanced indecision Long-Legged Doji: This candle has long wicks on both sides. It shows that the price moved a lot but closed close to the open. This shows strong trading indecision Dragonfly Doji: Looks like a "T". The long lower wick shows sellers pushed the price down, but buyers pulled it back up by close. Often seen near the bottom of a downtrend Gravestone Doji: Looks like an upside-down "T". A long upper wick shows buyers pushed the price up, but sellers dragged it back down. Often seen near the top of an uptrend What Does a Doji Tell Traders? (Indecision & Reversal Signals) A Doji pattern mainly signals one thing: uncertainty. Neither buyers nor sellers have full control during that session. A Doji after a strong trend is important. It can signal a possible reversal pattern. This means the current trend may be losing power and could change direction. A Dragonfly Doji that appears after a downtrend can signal a bullish reversal. In contrast, a Gravestone Doji after an uptrend may signal a bearish trend. But here's the honest part: a single Doji candle doesn't confirm anything on its own. It's a warning sign, not a certainty. How to Use Doji Candlestick in Trading (With Caution) To read Doji candlestick patterns well, don't rely on the candles; always use other tools too. Check the trend before and after the doji Look at support and resistance levels nearby Confirm with volume since a Doji on high volume carries more weight Wait for the next candle to confirm the direction It is like reading one line of a book. You can get hints, but not the full story. Doji Candlestick in the Indian Stock Market Context Doji candles frequently appear for Indian traders on the NSE and BSE. This is especially true during results season or major news events. These times bring more uncertainty to the market. Many beginners in the Indian stock market feel excited when they spot a Doji candlestick. They often expect an immediate reversal. That's a common mistake. Experienced traders treat it as one piece of the puzzle, not the whole picture. If you're new, start by finding Doji patterns on index charts like Nifty or Bank Nifty. Watch what happens after they form, and note how price reacts near key levels. Over time, this pattern recognition becomes second nature. A Doji candlestick is important for beginners. It boosts confidence in reading price charts. This knowledge can lead to better trading decisions.
What Is a Doji Candlestick?
September 24, 2026
Portfolio Diversification
What Is Portfolio Diversification?
September 23, 2026
What is hedging in the stock market
What Is Hedging in the Stock Market? 
September 22, 2026
Follow Us
Subscribe
Home/Stockmarket Simplified/Understanding Stock Buybacks: How They Affect Share Prices
Stockmarket Simplified

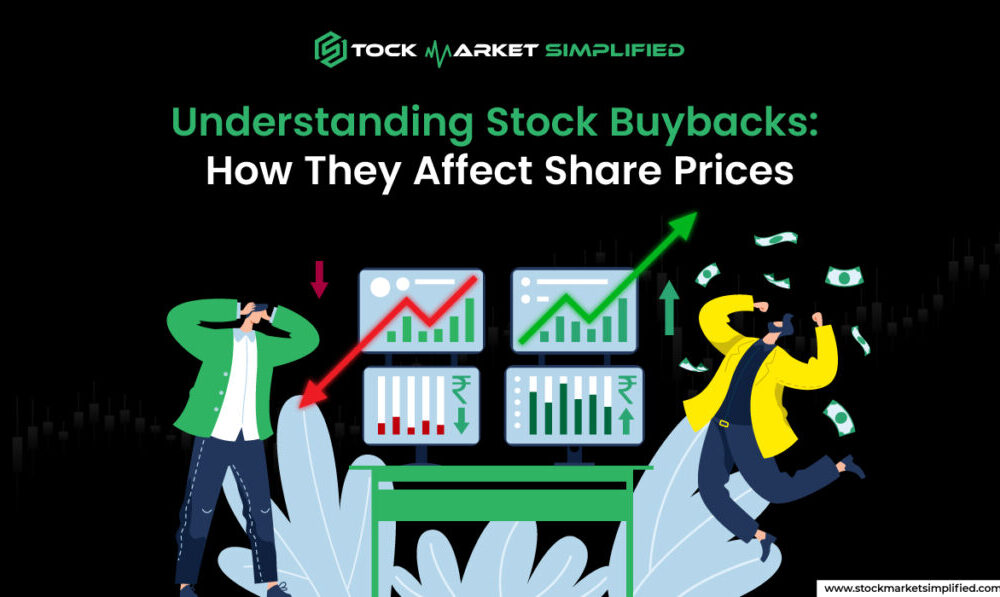
Understanding Stock Buybacks: How They Affect Share Prices

Introduction to Stock Buybacks Have you heard of IPOs? When a company needs funds to grow its business, it brings a public issue to sell its shares for a price. Once the share gets listed on the...

Manaswi Agarwal
Manaswi Agarwal
October 28, 2024 5 Min Read
417 0

Introduction to Stock Buybacks

Have you heard of IPOs? When a company needs funds to grow its business, it brings a public issue to sell its shares for a price. Once the share gets listed on the stock exchange, demand and supply keep the market price moving unless the company plans a stock buyback.

Table Of Content

  • Introduction to Stock Buybacks
  • What Is a Stock Buyback?
  • Reasons Companies Buy Back Shares
  • Impact of Stock Buyback on Share Prices
  • Long-Term vs. Short-Term Effects
  • Risks and Considerations for Investors
  • Conclusion: Evaluating Buybacks in Investment Decisions

Yes. It is a common practice for companies to buy back their own shares. But what is a stock buyback? How does it affect the share price? How does the market perception change regarding buyback? And why do companies buy back stock in the first place? Don’t worry. We answer all your questions in this blog.

What Is a Stock Buyback?

What Is a Stock Buyback

Stock buyback refers to the practice often used by companies to buy their shares. The price offered for a stock buyback is usually much above the market price of the share. A company can buy back either from the open market or through a tender offer.

Open market purchase

The company buys its shares at the current market price, driving demand upward and leading to a price rise.

Tender offer

The company offers to pay the shareholders a premium over the market price to repurchase the shares.

To put it simply, a company uses its excess cash reserves to purchase its shares. Usually, when a company has excess cash, it is inclined to offer a dividend to shareholders. However, there are several benefits to a stock buyback, like:

  • Returning value to the shareholders.
  • Reducing the total number of outstanding shares available for trading.
  • Consolidating ownership of the company.
  • Increasing the value of remaining shares.
  • Sparking investor interest in the shares.
  • Use surplus cash to bring the undervalued share to its fair value.

Reasons Companies Buy Back Shares

Reasons Companies Buy Back Shares

Now, it is a fair question to ask, why do companies buy back stock? What motivation does a company have for buying back its own shares? Well, here are the reasons for the buyback of shares:

Stock is Undervalued

A stock is undervalued because investors do not have enough confidence in it. So, the company initiates a stock buyback to show confidence in its future to the shareholders.

Low Volatility

In a scenario with little volatility, a company can buy back shares to boost investor trust. Lesser shares in the market shoot up the EPS and increase the demand for the stock.

Return the Value to Shareholders

Instead of paying dividends, companies can alternatively provide benefits to shareholders by buying back at a premium.

Improve Financial Ratios

A stock buyback improves all stats that are calculator per share, especially EPS (Earning Per Share) and the P/E ratio.

Prevent Hostile Takeovers

When a huge chunk of a company’s stock is issued for public ownership in the free market, there are more chances of a hostile takeover. Competitors with the necessary means might play badly and accumulate enough shares in a company to own the controlling interest. Stock buyback reduces the number of tradeable shares, limiting the possibility of a hostile takeover.

Save Taxes

Buyback of shares leads to capital gains, which are more tax efficient for shareholders compared to dividends. DDT is 17.65% in India, while long-term capital gains tax is only 10%. LTCG is exempt if the gains are up to Rs. 1 lakh.

Impact of Stock Buyback on Share Prices
Impact of Stock Buyback

Now that you understand the reasons for buying back shares let’s examine how a buyback affects share prices.

Supply and Demand

Demand and supply are the forces of free markets, and this holds true for stock markets as well. By initiating a stock buyback, the company creates a high demand for its shares. The stock price increases as investors start buying shares to get the premium on the buyback. 

Once the shares are out of the market, the supply of shares reduces, but the demand remains high. It leads to a further rise in stock prices and improves investor confidence.

Effects on Earnings Per Share (EPS)

Profitability is a key indicator that a company is afloat and earning well for its shareholders. However, more outstanding shares in the market mean lower EPS (Earnings Per Share). So, stock buyback is an effective means to increase the EPS.

Investors also see P/E (Price to EPS ratio) to judge whether a stock is overpriced or underpriced. A higher EPS means a lower P/E ratio. Consequently, investors see more potential for an increase in the stock price.

Market Perception and Investor Sentiment

One of the reasons for the buyback of shares is improving market sentiments. A buyback sends a positive signal to the shareholders as the company shows confidence in its own stock. There can be both positive and negative impacts on market sentiments:

Positive Impact

The buyback can be positively perceived as:

  • The management is confident in the company’s future.
  • Stock is undervalued.
  • The company is financially strong.
  • The company has surplus cash reserves.

Negative Impact

The buyback can be negatively perceived as:

  • Short-term manipulation of share prices.
  • The company is artificially trying to lure the shareholders.
  • The company’s growth is stagnant. Hence, there is free cash.
  • There is no demand for the stock in the markets.

Also Read: Short Selling Explained: How Investors Profit from Market Declines

Long-Term vs. Short-Term Effects
Long-Term vs. Short-Term Effects
Short-term effects of Stock BuybackLong-term effects of Stock Buyback
Boost in share pricesImproves financial ratios like:EPSP/E RatioIncreases demand and trade volumesIncreases confidence in the shareholdersRemoves the possibility of hostile takeoversThe long-term effect of the buyback depends on the company’s growth. If the company doesn’t grow and the stock price rises, making it overvalued, its success can be rather short-lived.If a company tries to artificially manipulate share prices through stock buybacks, it can hurt in the long run.

Risks and Considerations for Investors
Risks and Considerations for Investors

Prima facie, stock buyback can look like an ideal strategy. But it has its fair share of downsides as well. So, how do you figure out whether a buyback is worth it? Here are the things you should consider:

  • Is the stock undervalued?
  • What is the reason for the buyback of shares?
    • Short-term tricks to inflate the price artificially.
    • Provide value to shareholders in the long term.
  • Is the company using free cash reserves or borrowing money to fund the buyback?

Conclusion: Evaluating Buybacks in Investment Decisions

Large companies sometimes use stock buybacks. They are powerful tools for providing value to shareholders, but they also have drawbacks. Investors should know the reasons for the buyback of shares. They should evaluate whether manipulating share prices is a shortsighted decision or if the intention is to provide long-term value to the shareholders.


Share Article

Manaswi Agarwal

Manaswi Agarwal Content Writer (Finance, Stock market)

Meet the weaver of words and a sorcerer of finance storyteller, Manaswi Agarwal, who can convey unfiltered data into golden nuggets. In GTF, content writing is about being a relentless researcher and conquering the digital realm through financial knowledge. With a vision of transforming mundane topics into meaningful insights and wisdom since two years, she has been constantly honing her craft while staying versed with the industry trends. She puts her knowledge in writing as a blend of creativity and craftsmanship to meet the growing landscape of content creation. Her work focuses to illuminate GTF students towards the path of stock market literacy with each word that she writes.

Previous Post

How to Spot Undervalued Stocks: A Value Investor’s Guide

Next Post

List of High-Dividend Paying Indian Stocks (2024)

Top Authors
Suhani
SuhaniContent Writer
99 Posts
Manaswi Agarwal
Manaswi AgarwalContent Writer (Finance, Stock market)
50 Posts
Top Categories
Stockmarket Simplified Stockmarket Simplified
50 Posts
Glossary Glossary
58 Posts
Most Viewed
What Is a Doji Candlestick? A Doji candlestick appears like a plus sign or a cross on stock charts. If you've seen one, that's what it is. In simple terms, a Doji candlestick forms when the open and close prices of a stock are almost the same. It shows a tug-of-war between buyers and sellers, where neither side wins clearly. The Doji is a key candlestick pattern for beginners to learn. Doji Candlestick Meaning The word "Doji" comes from Japanese, and it roughly means "mistake" or "the same." That's fitting because a Doji candle shows a moment when the market couldn't decide which way to go. Think of it as a rope-pulling contest. Buyers pull one way, while sellers pull the other. By the end of the session, both sides are nearly back where they began. That's the core Doji pattern meaning for beginners. How a Doji Candle Forms (Open and Close Prices) Every candlestick has four price points: open, high, low, and close. In a normal candle, the open and close prices differ quite a bit, which gives the candle a thick body. In a Doji candlestick, the open and close prices are nearly equal. This forms a thin or nearly invisible body. Wicks, or shadows, extend above and below. Those wicks show how much the price moved during the session. Then, it returned close to the opening level. Main Types of Doji Patterns Not all Doji candles look the same. Here are the main types every trader should recognize: Standard/Neutral Doji: Small wicks on both sides, showing balanced indecision Long-Legged Doji: This candle has long wicks on both sides. It shows that the price moved a lot but closed close to the open. This shows strong trading indecision Dragonfly Doji: Looks like a "T". The long lower wick shows sellers pushed the price down, but buyers pulled it back up by close. Often seen near the bottom of a downtrend Gravestone Doji: Looks like an upside-down "T". A long upper wick shows buyers pushed the price up, but sellers dragged it back down. Often seen near the top of an uptrend What Does a Doji Tell Traders? (Indecision & Reversal Signals) A Doji pattern mainly signals one thing: uncertainty. Neither buyers nor sellers have full control during that session. A Doji after a strong trend is important. It can signal a possible reversal pattern. This means the current trend may be losing power and could change direction. A Dragonfly Doji that appears after a downtrend can signal a bullish reversal. In contrast, a Gravestone Doji after an uptrend may signal a bearish trend. But here's the honest part: a single Doji candle doesn't confirm anything on its own. It's a warning sign, not a certainty. How to Use Doji Candlestick in Trading (With Caution) To read Doji candlestick patterns well, don't rely on the candles; always use other tools too. Check the trend before and after the doji Look at support and resistance levels nearby Confirm with volume since a Doji on high volume carries more weight Wait for the next candle to confirm the direction It is like reading one line of a book. You can get hints, but not the full story. Doji Candlestick in the Indian Stock Market Context Doji candles frequently appear for Indian traders on the NSE and BSE. This is especially true during results season or major news events. These times bring more uncertainty to the market. Many beginners in the Indian stock market feel excited when they spot a Doji candlestick. They often expect an immediate reversal. That's a common mistake. Experienced traders treat it as one piece of the puzzle, not the whole picture. If you're new, start by finding Doji patterns on index charts like Nifty or Bank Nifty. Watch what happens after they form, and note how price reacts near key levels. Over time, this pattern recognition becomes second nature. A Doji candlestick is important for beginners. It boosts confidence in reading price charts. This knowledge can lead to better trading decisions.
What Is a Doji Candlestick?
September 24, 2026
Portfolio Diversification
What Is Portfolio Diversification?
September 23, 2026
What is hedging in the stock market
What Is Hedging in the Stock Market? 
September 22, 2026

Related Posts

Stockmarket Simplified
What is the Moving Average Convergence Divergence (MACD) Indicator?
Manaswi Agarwal
By Manaswi Agarwal
Stockmarket Simplified
What Is the Debt to Equity Ratio Formula and How Does It Work?
Manaswi Agarwal
By Manaswi Agarwal
Stockmarket Simplified
How to Select Stock for Swing Trading?
Manaswi Agarwal
By Manaswi Agarwal
Stockmarket Simplified
Your Ultimate Reference Guide to Pattern Day Trading
Manaswi Agarwal
By Manaswi Agarwal
instagram image
instagram image
instagram image
instagram image
instagram image
instagram image
Instagram
stockmarketsimplified stockmarketsimplified
  • contact@stockmarketsimplified.com
Helpful Links
  • Glossary
  • Contact
  • Privacy Policy
  • Terms And Conditions
Popular Posts
What Is Concentration Risk? 
Suhani
September 28, 2026
What Is Implied Volatility?
Suhani
September 27, 2026
9 SME IPO Risks to Know Before You Invest 
Suhani
September 26, 2026
Follow Us
Facebook
Twitter
Youtube
Instagram
Stay Informed
©Copyright 2026. stockmarketsimplified.com. All Rights Reserved